Joseph
Saba

Builder & Analytics Consultant

I build internal tools and analyics platforms

I build internal tools, web apps, and automation systems - currently shipping an LLM-powered SaaS product, an A/B testing platform, and a live algorithmic trading system. A decade in commercial analytics across FMCG and retail taught me how to read a business problem before reaching for code, and how to get it done.

Years Experience
10+
across analytics, reporting, and commercial decision support
Projects Delivered
20+
dashboards, models, pipelines
Location
Melbourne, AU
available in-person, remotely, and for coffee
Category dashboard analytics project screenshot
Python LLM FastAPI
Revisi
LLM-powered brand voice auditor that scans a website, checks every page against brand voice metrics, and generates a report with specific recommendations. Built in Python and FastAPI.
Category dashboard analytics project screenshot
Python FastAPI
SplitPea
An A/B testing and website analytics platform with a lightweight snippet and easy-to-use visual editor.
LGA language explorer census dashboard screenshot
JavaScript Public Data Data Visualisation
LGA Language Explorer
What languages are spoken in your suburb - and how has that changed over 15 years? Interactive explorer built on harmonised ABS Census data across 8,465 suburbs and 549 LGAs, with projections to 2026. Search any area in Australia.
Trading performance analytics projection chart screenshot
Python SQLite FastAPI HTMX
Trading Performance
Full-stack trading analytics platform built in Python, FastAPI, HTMX, and SQLite to track performance, discipline, and edge quality over time. Includes behavioural scoring, setup analysis, weekly scorecards, and projection tooling designed to connect trading process to outcomes.
Lego range review analytics project screenshot
Python Plotly Research
Lego Range Review
Exploratory analysis of Lego’s product range from the 1980s to 2025, combining pricing, product mix, and market context to understand the drivers behind its long-term growth. Built as a structured research project using Python and Plotly, then presented as a visual analysis deck.
Languages
Python SQL JavaScript HTML / CSS
Frameworks
FastAPI HTMX Streamlit Plotly
BI & Data
Power BI SQLite PostgreSQL Pandas / NumPy
What I Build
Web Apps AI Tools Data Pipelines Dashboards & Reports
AI & Tooling
Claude Code Anthropic API LLM Integrations Visual Studio Code
2025 – Present
Current
Data Analyst & Developer
Self-Employed
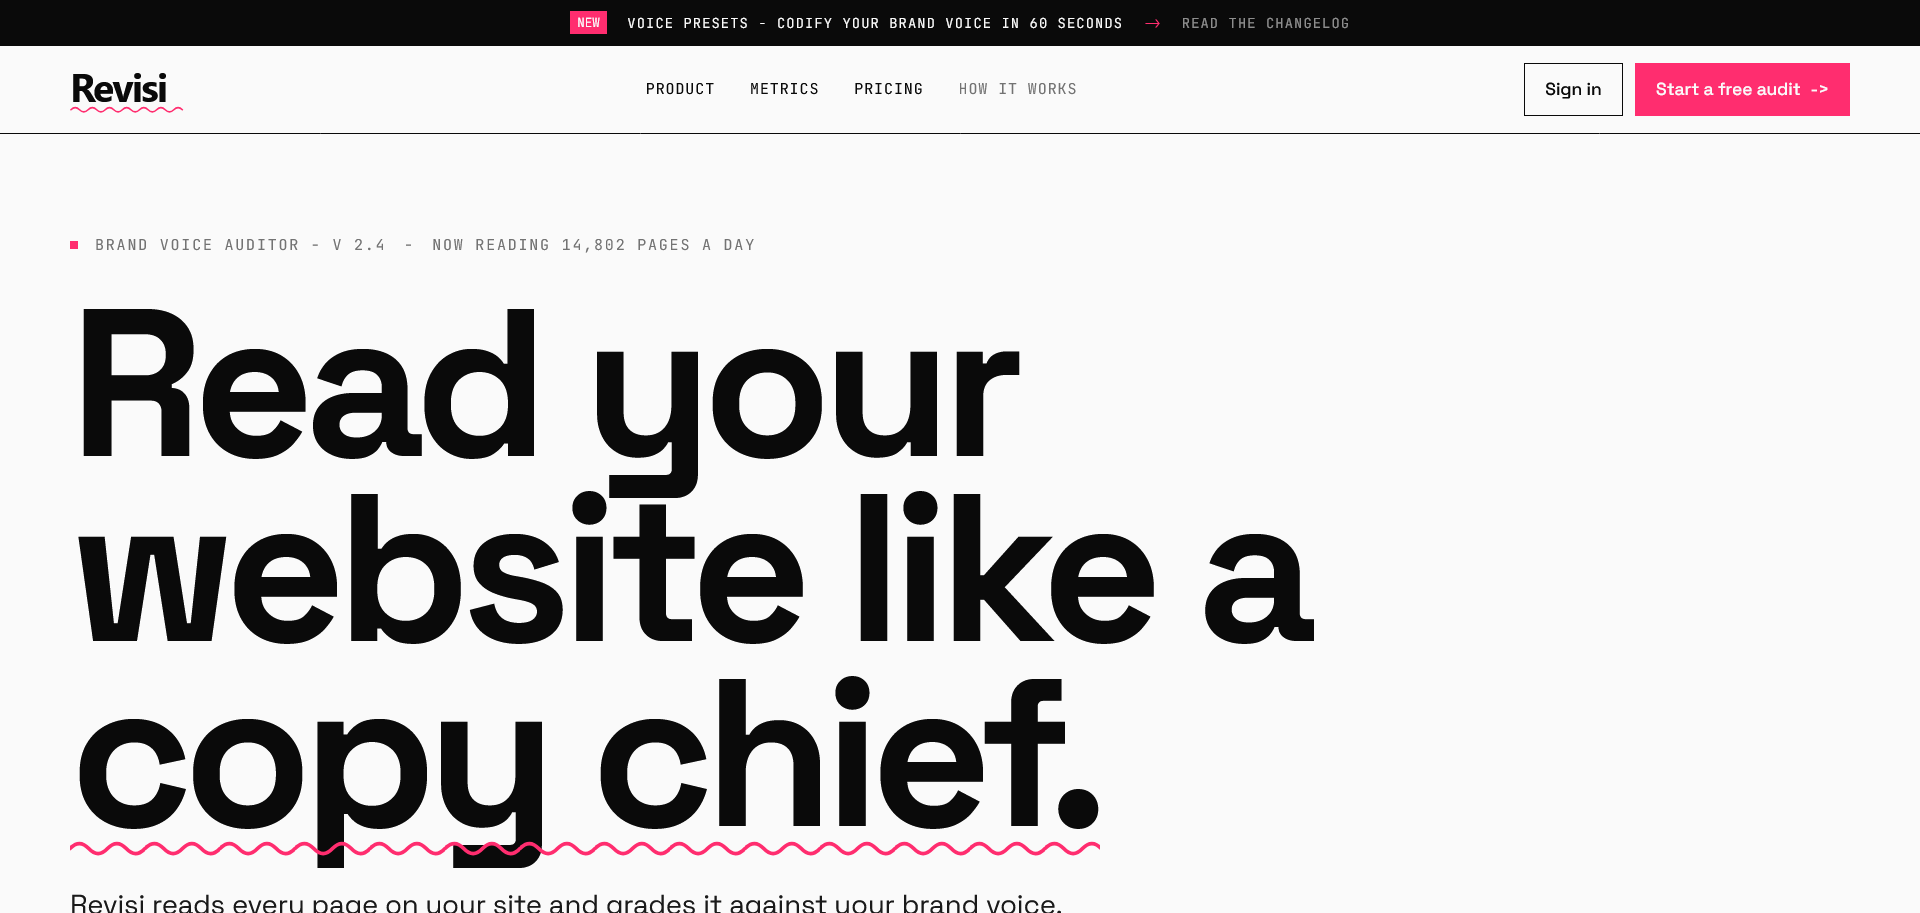
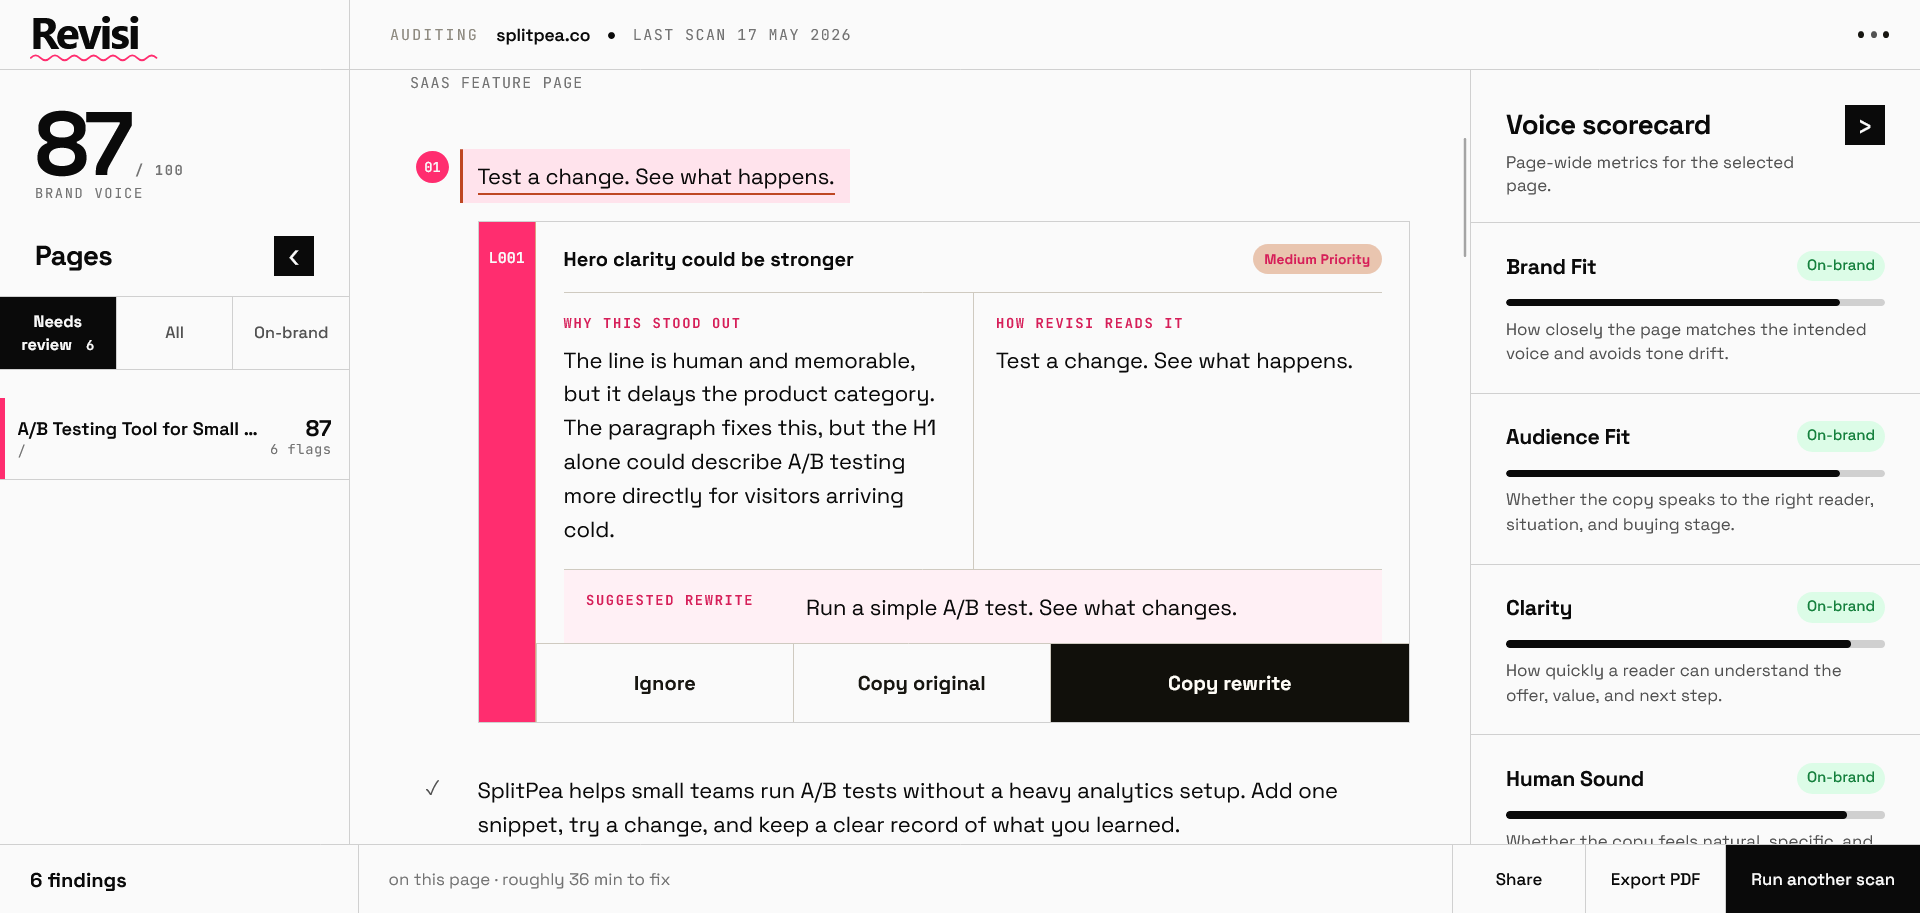
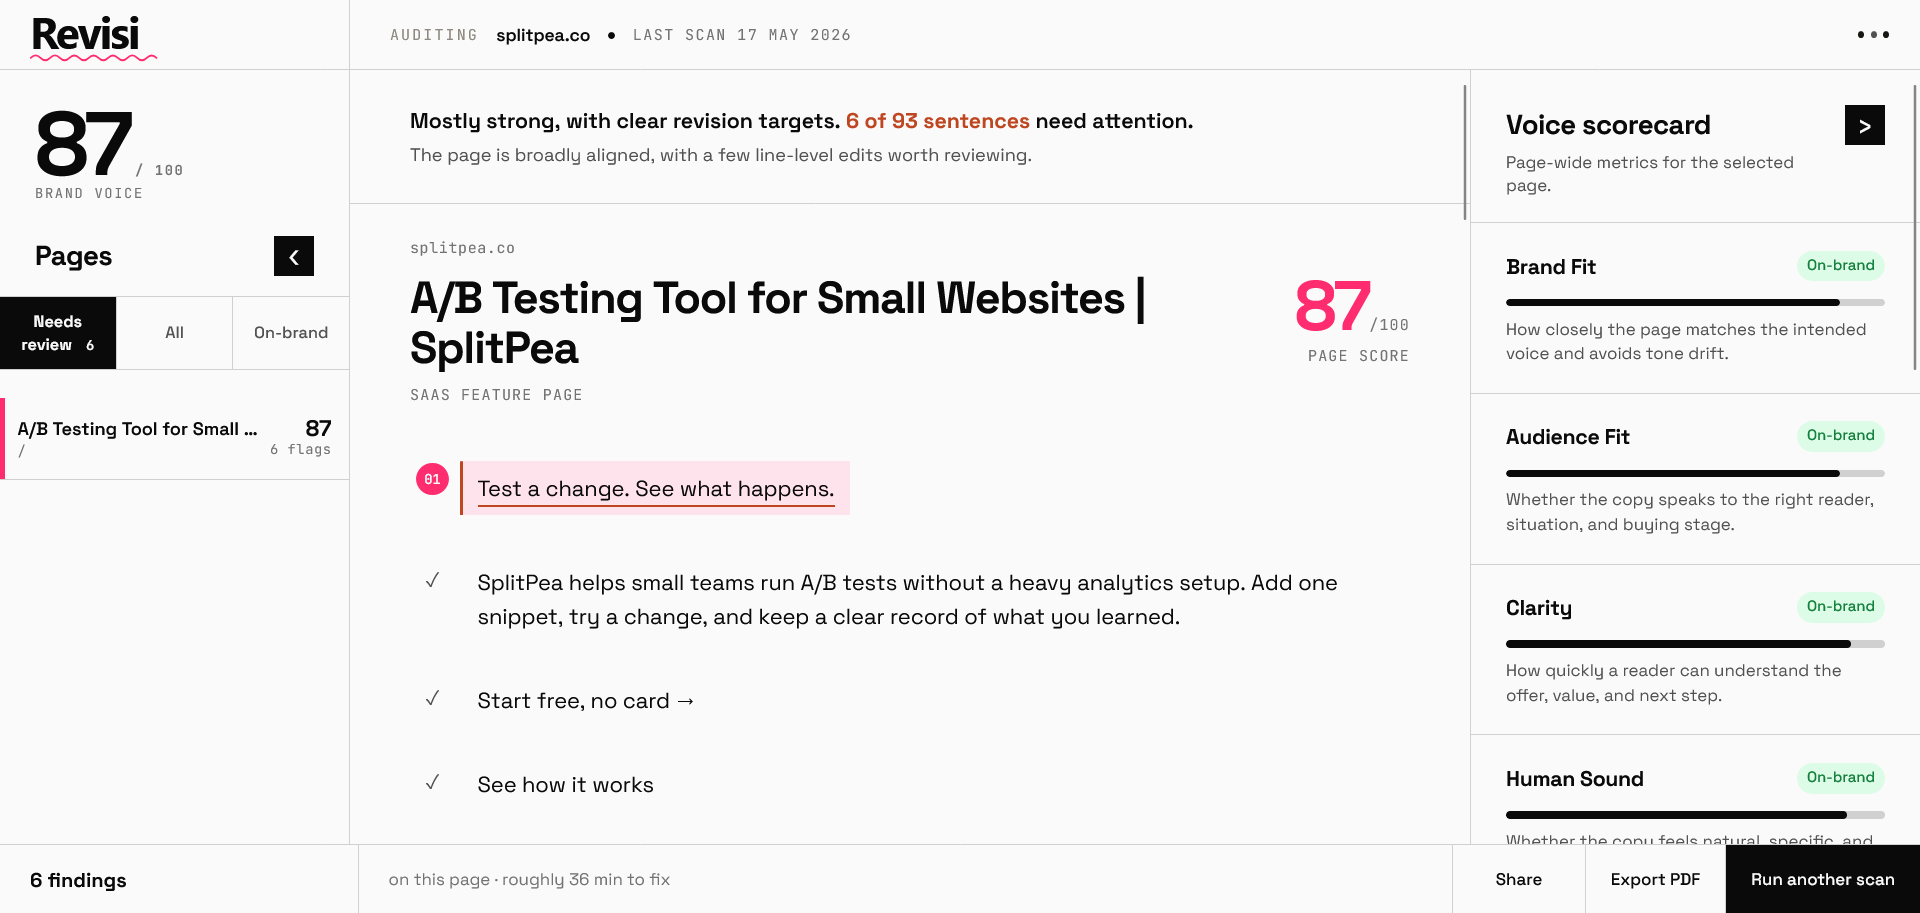
Building products end-to-end in Python - currently shipping Revisi (LLM-powered brand auditor), 
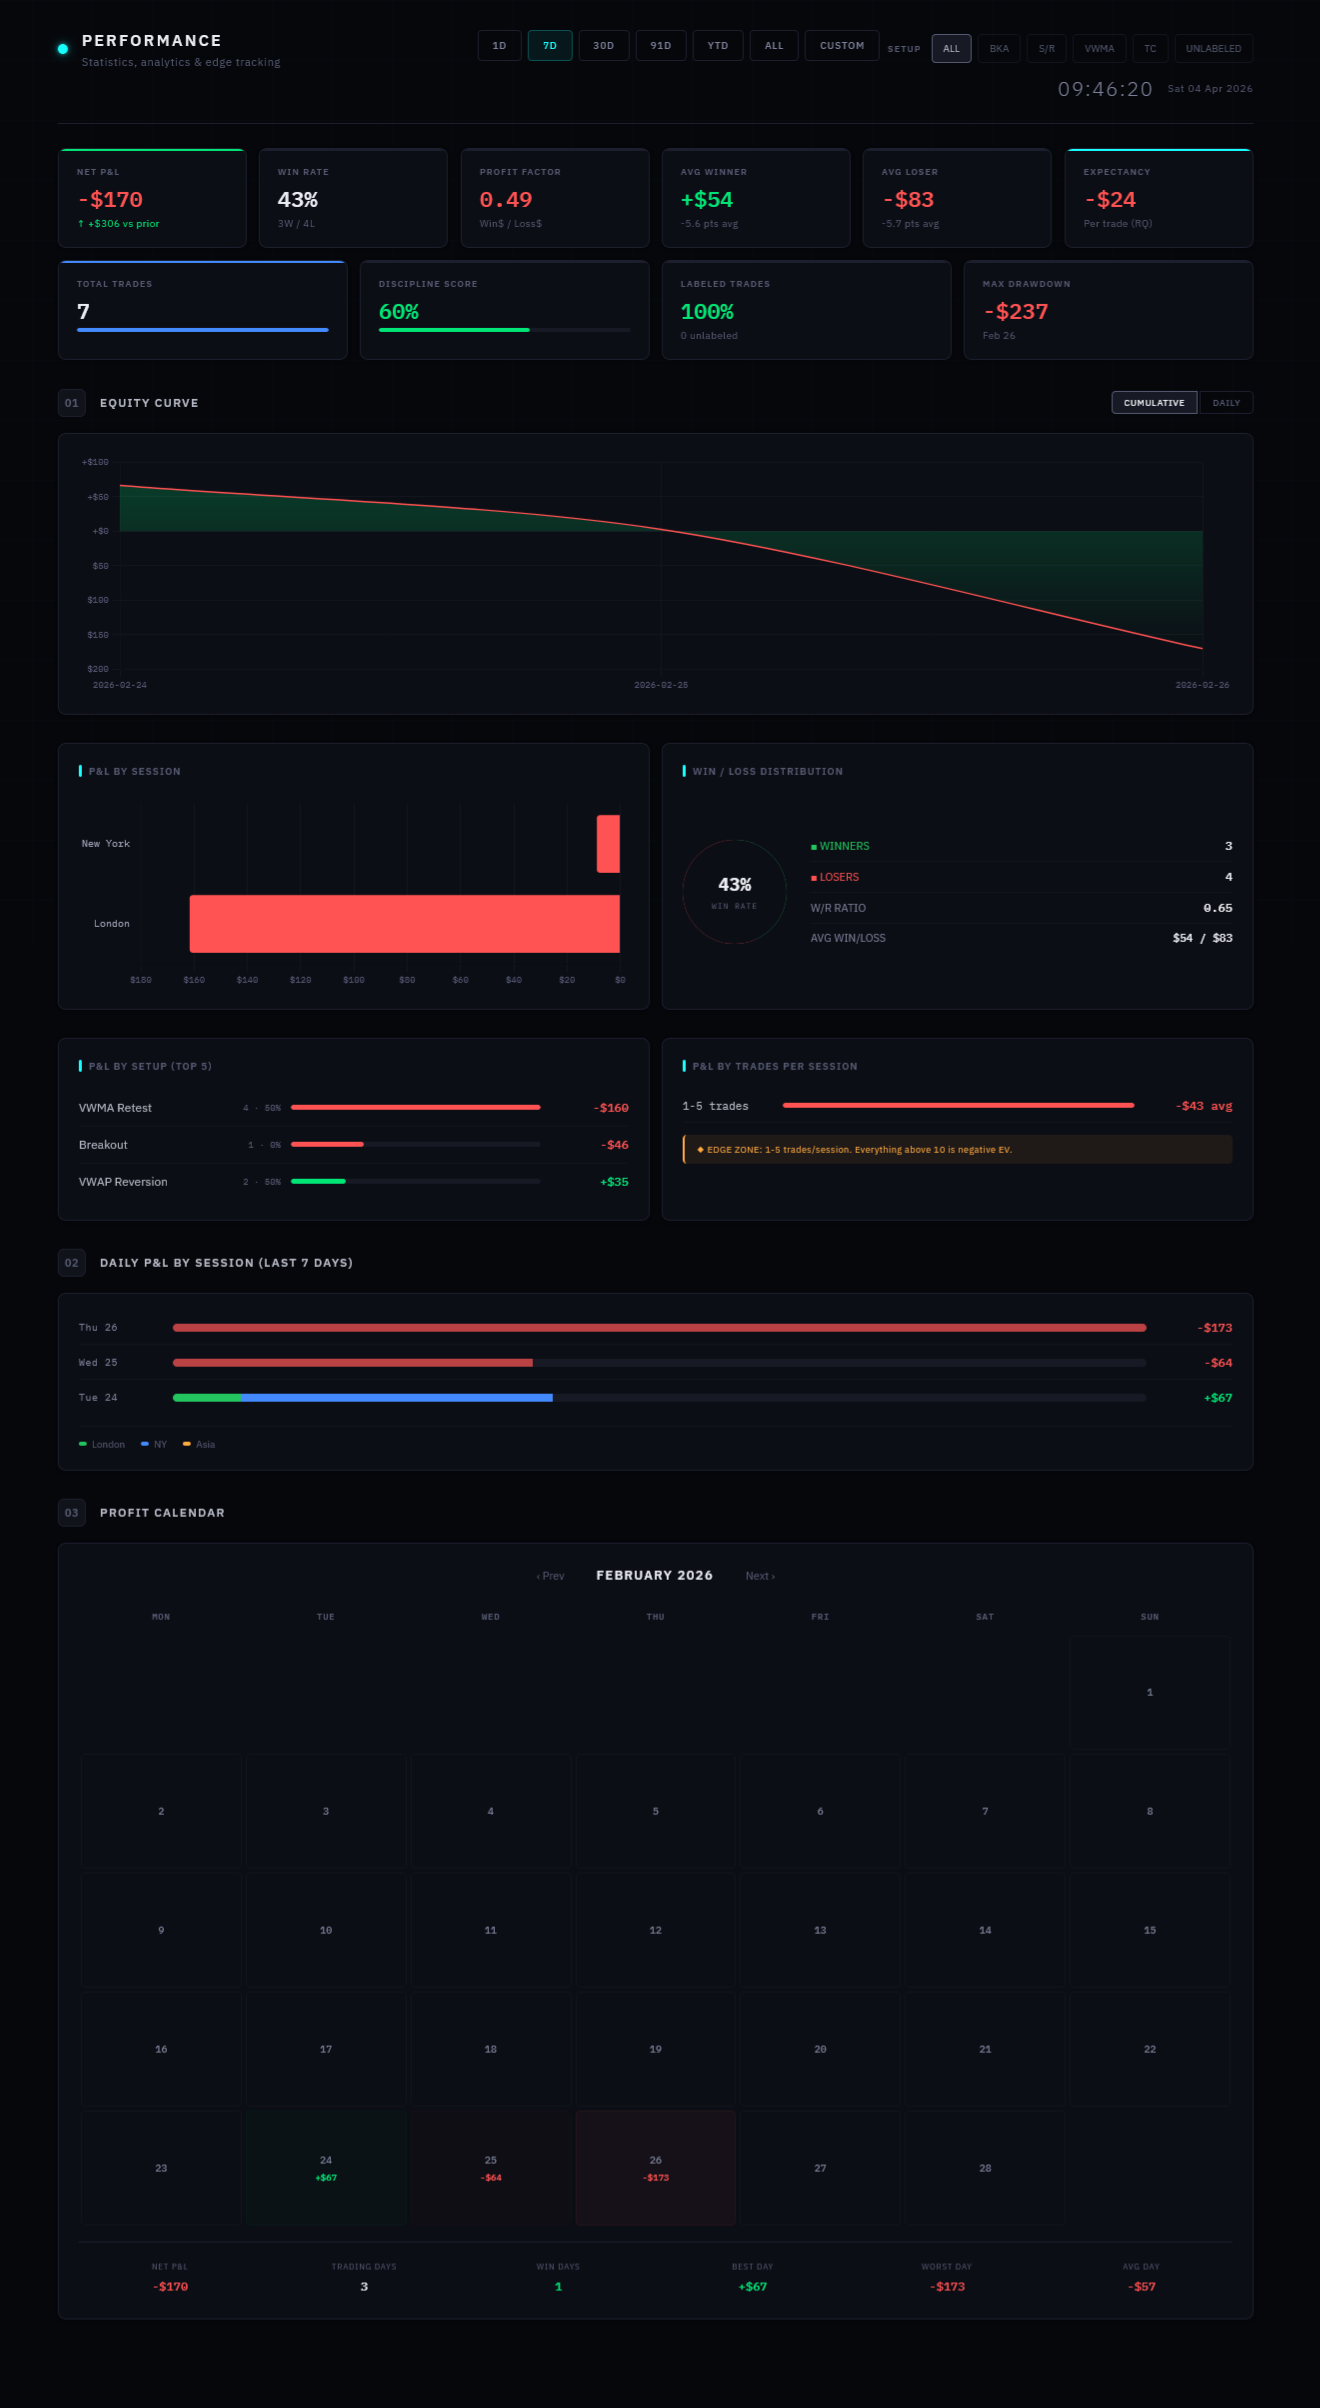
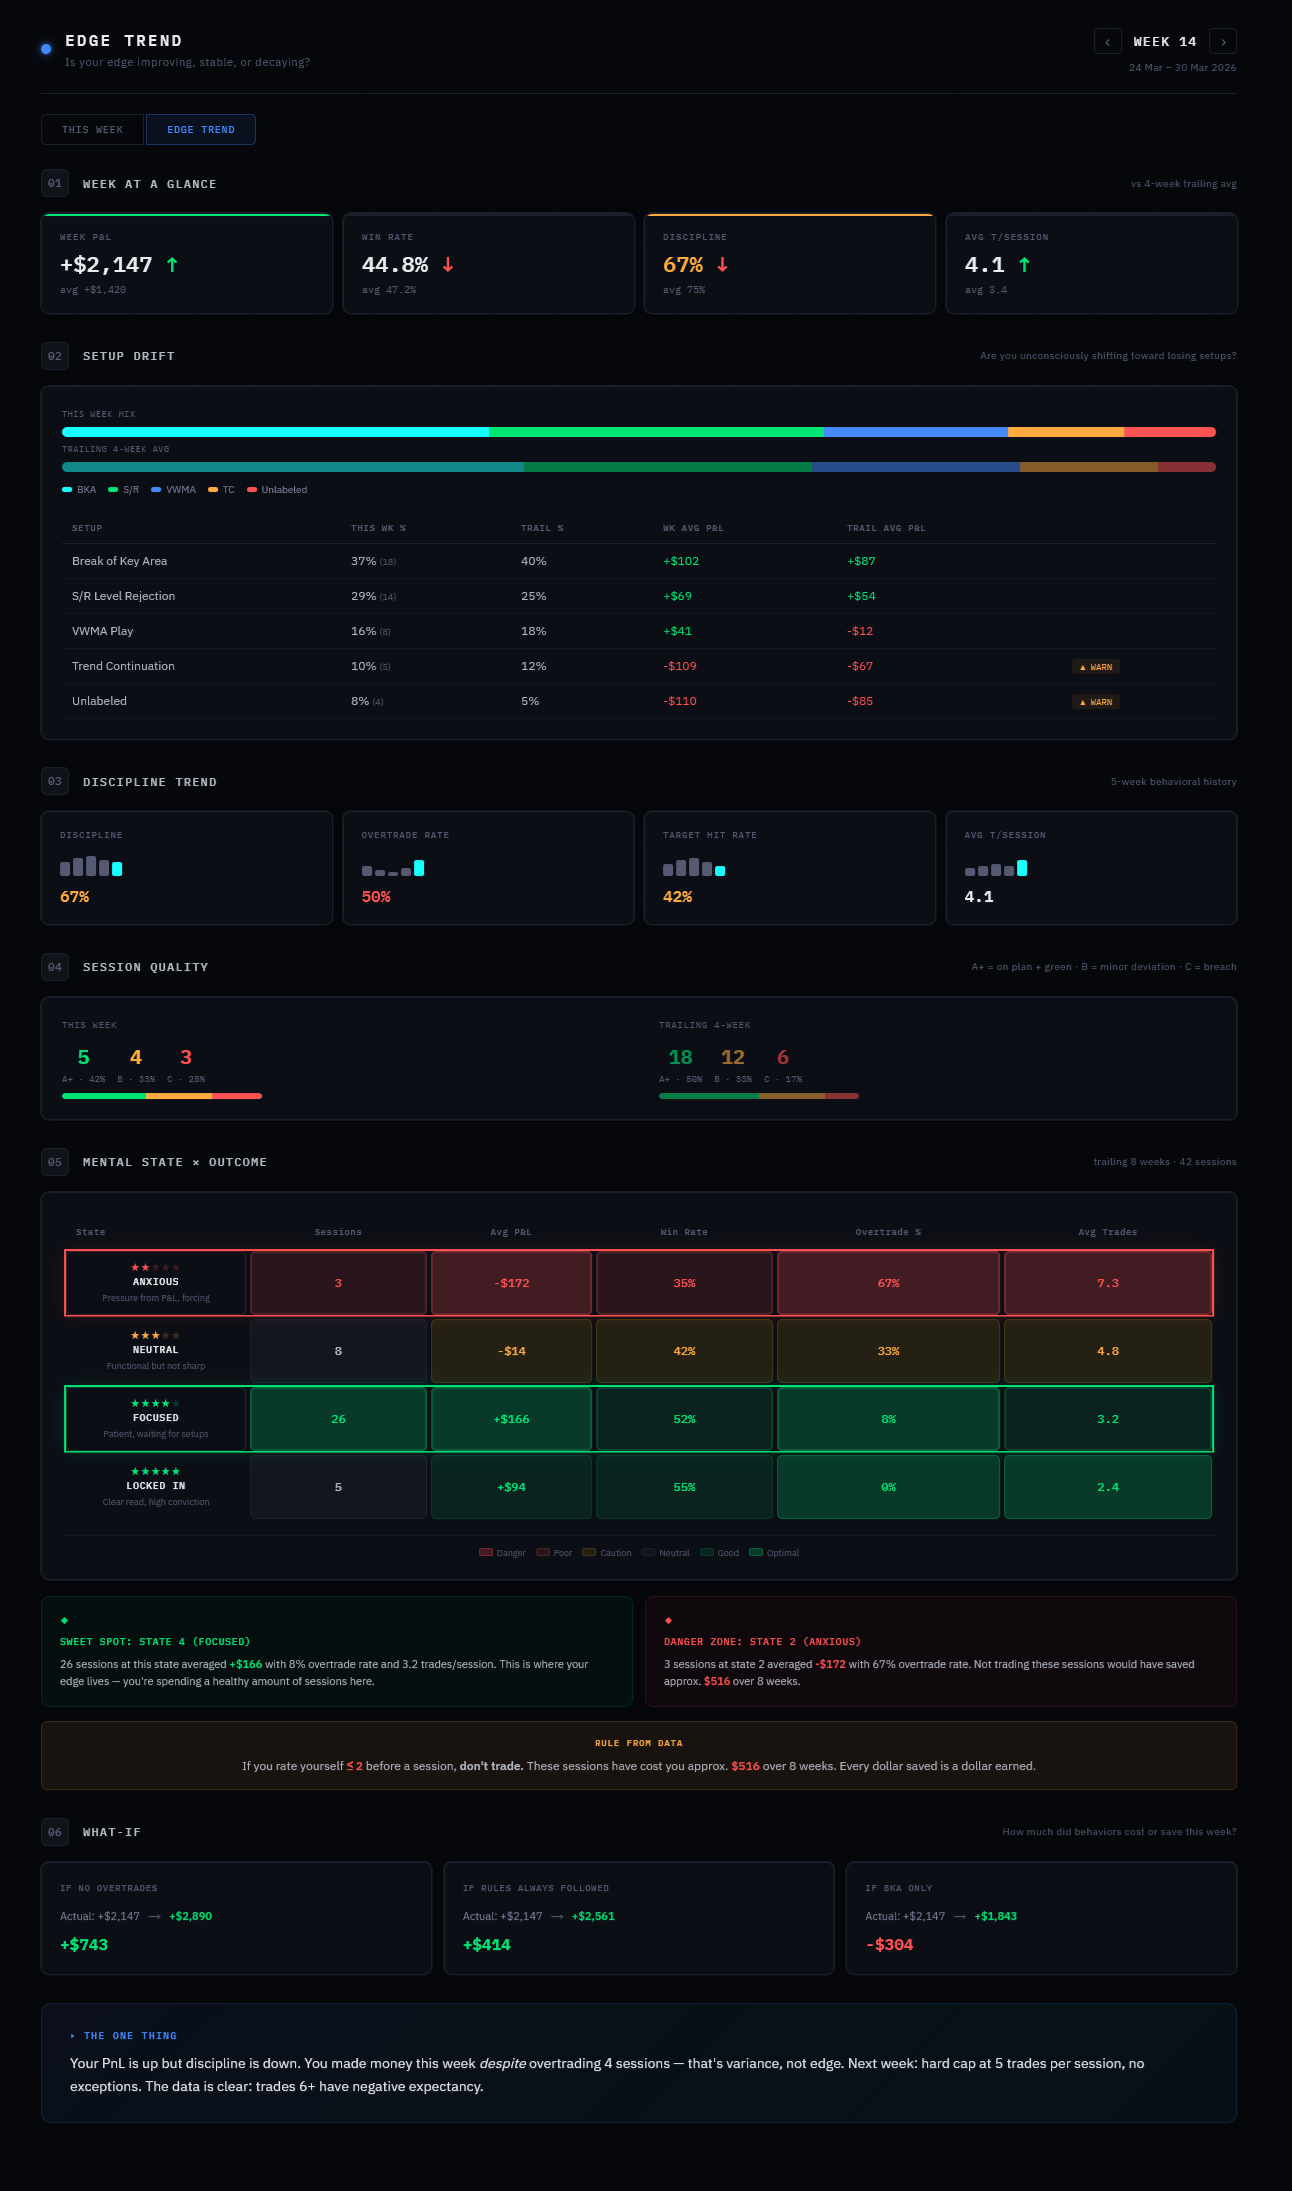
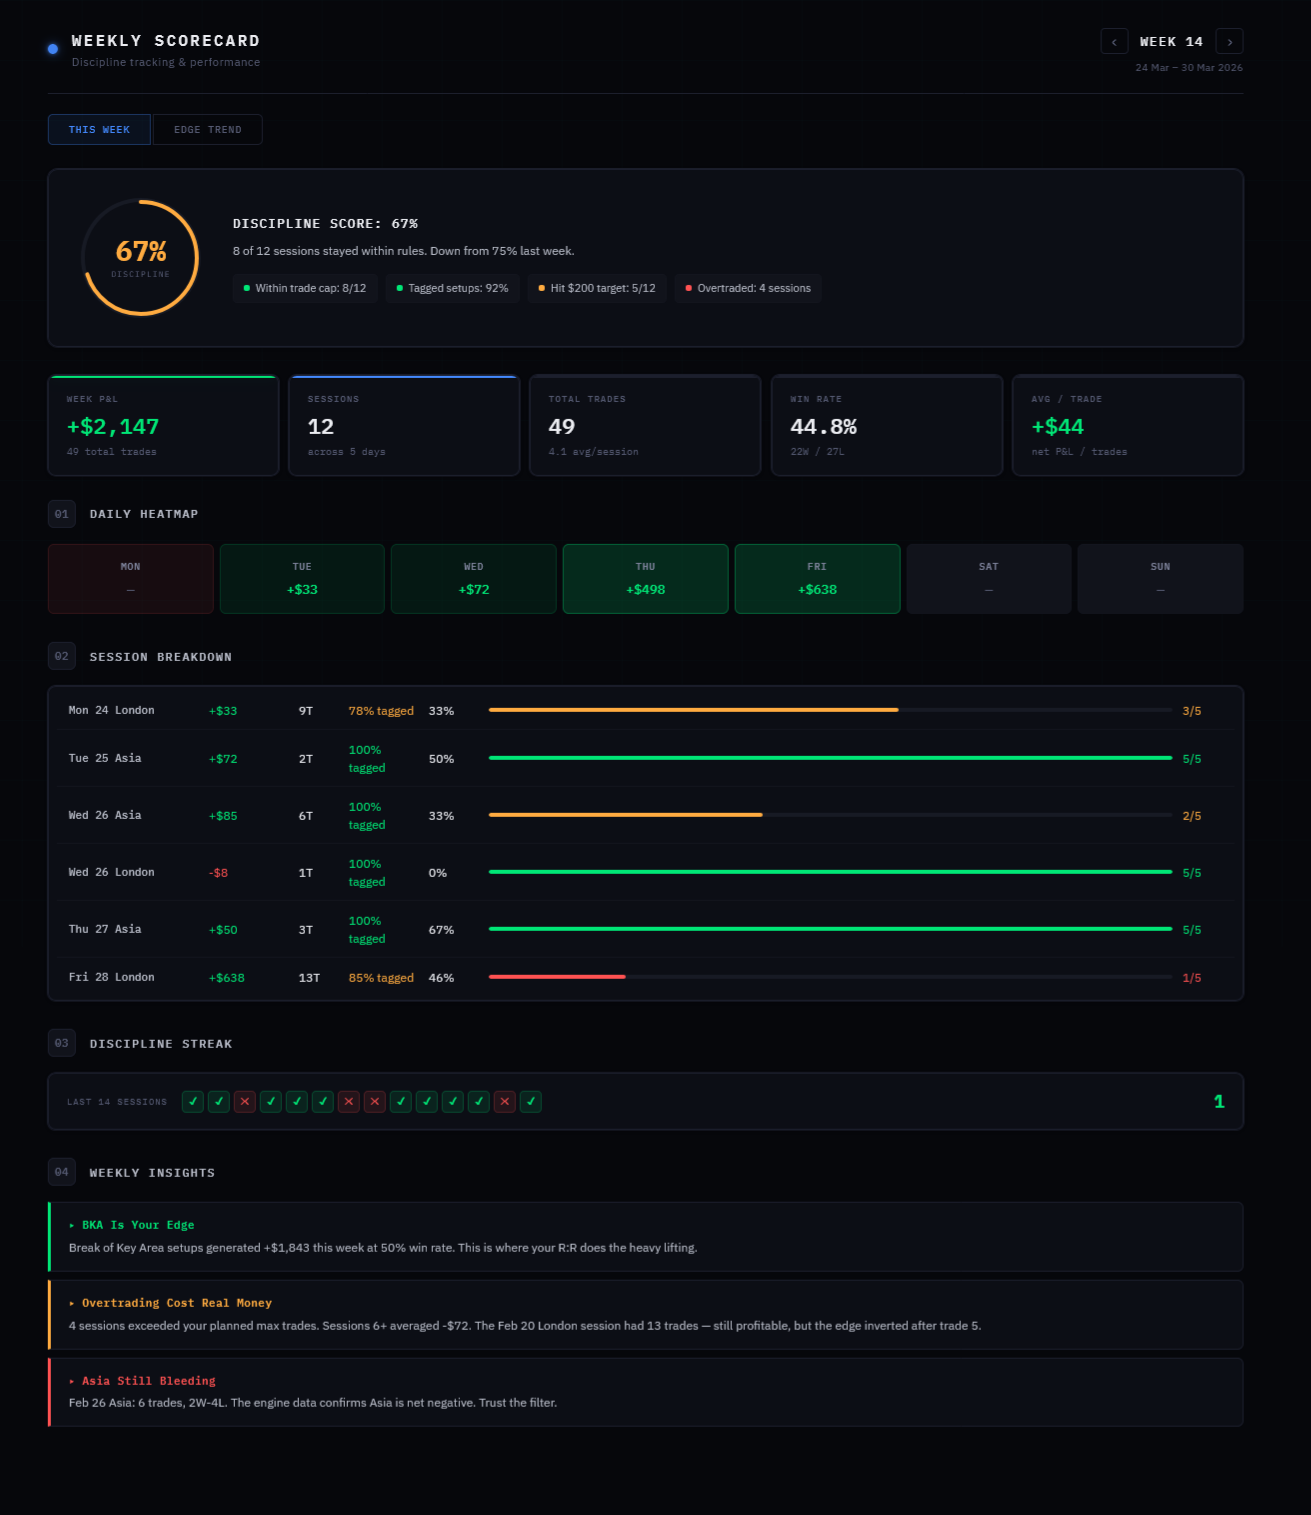
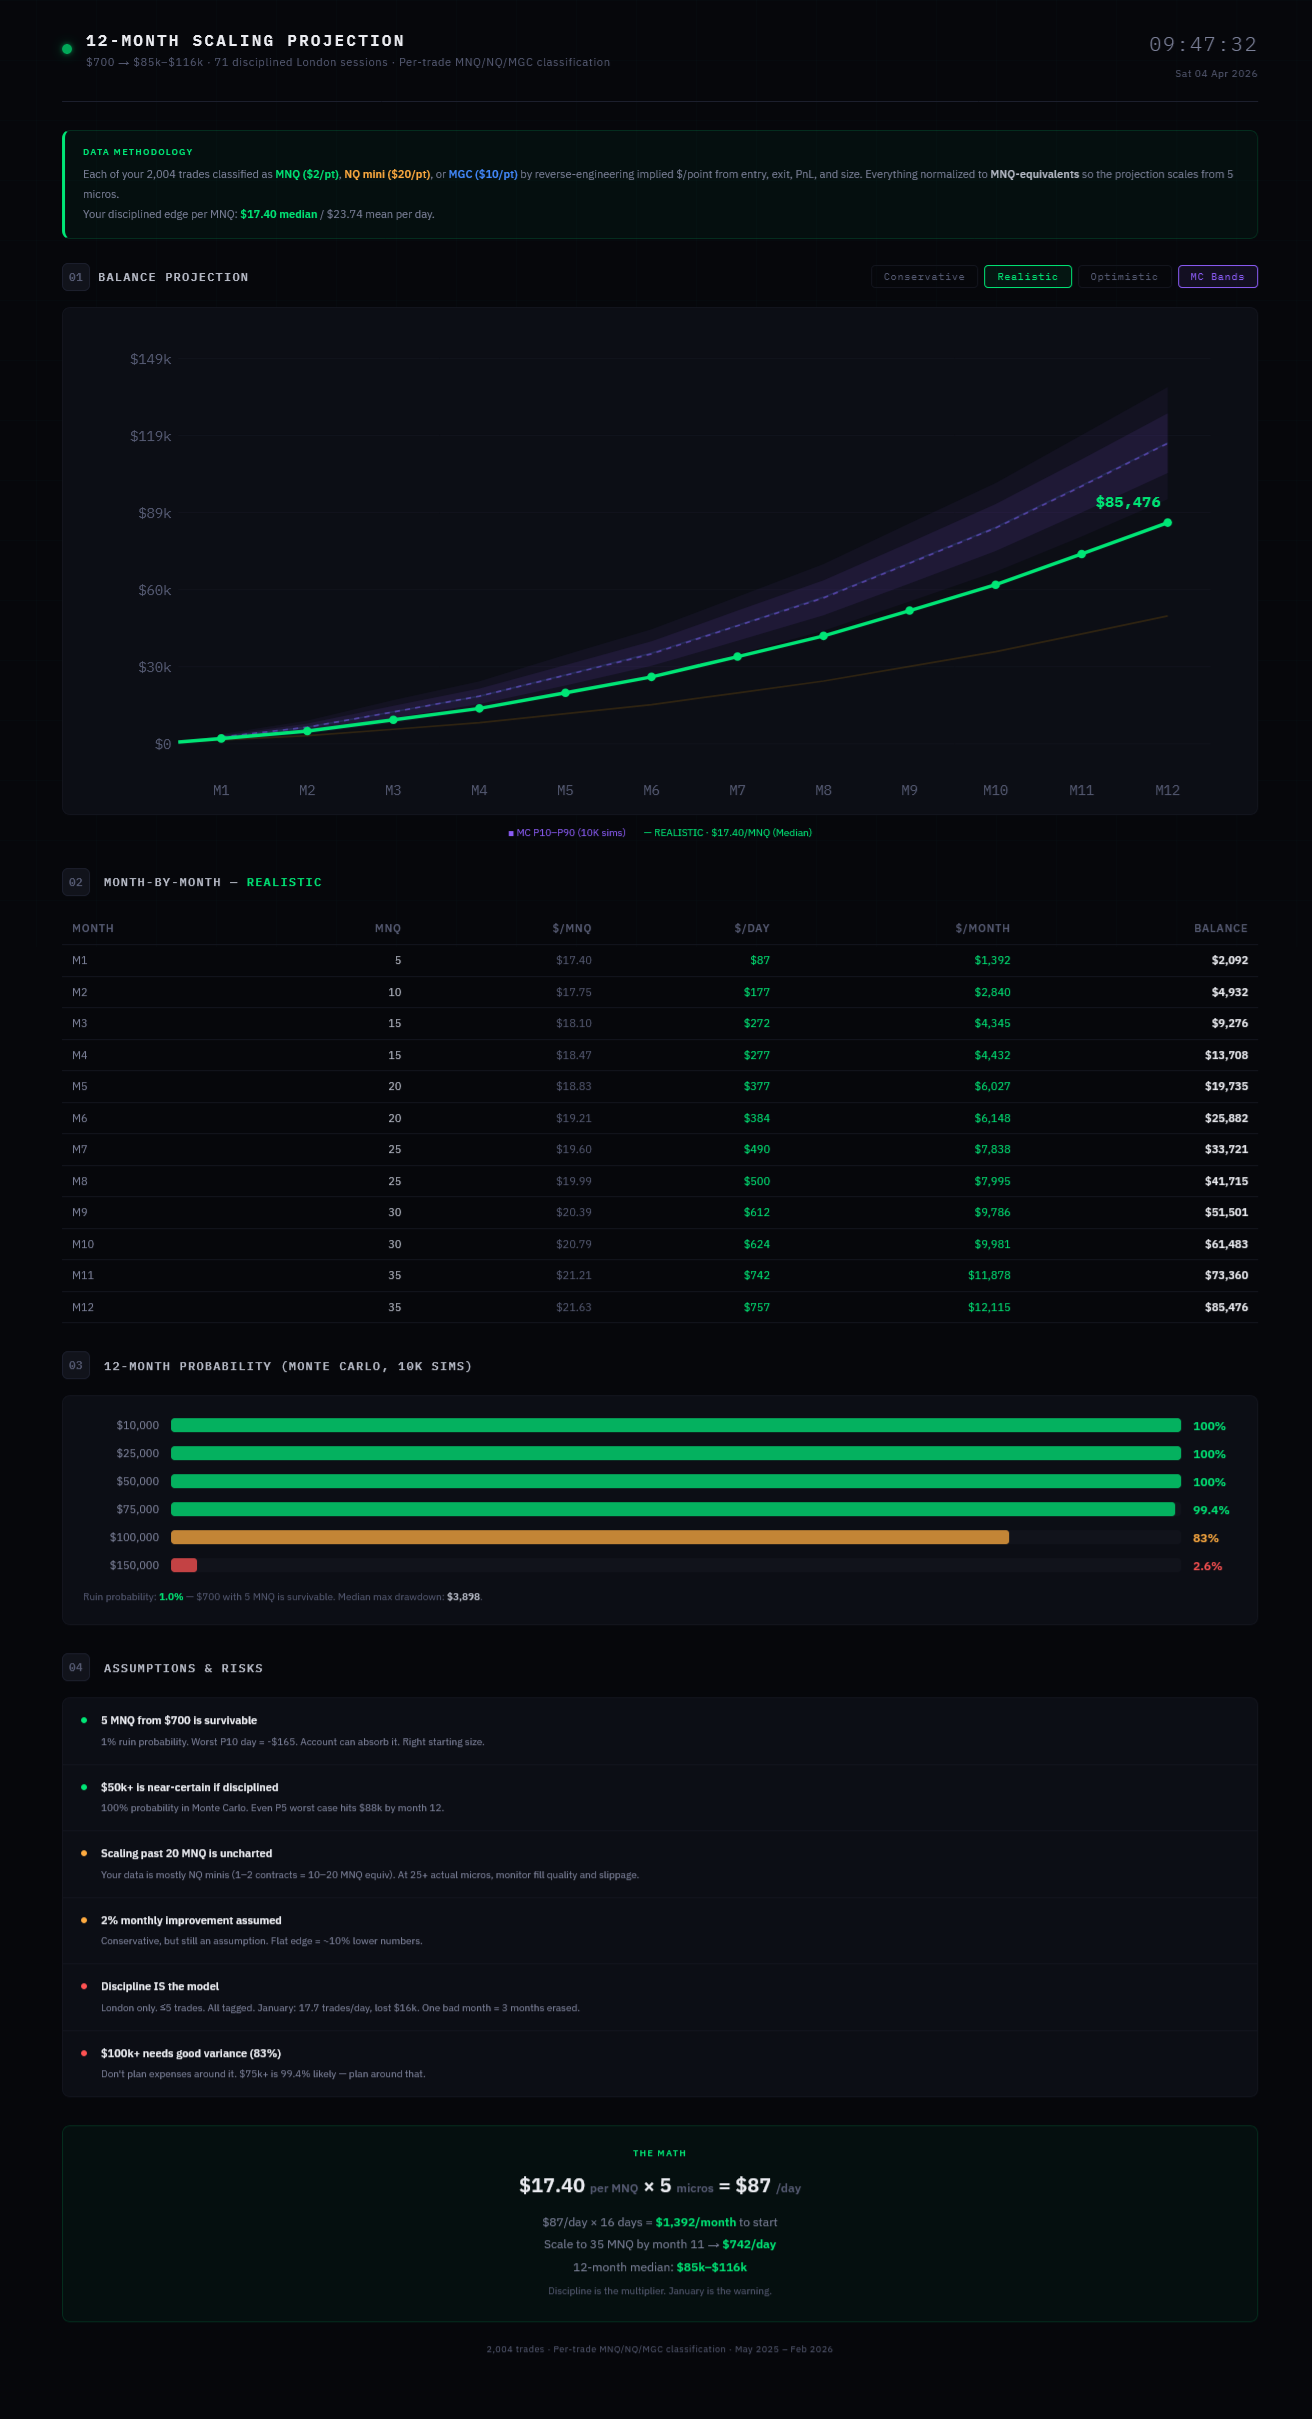
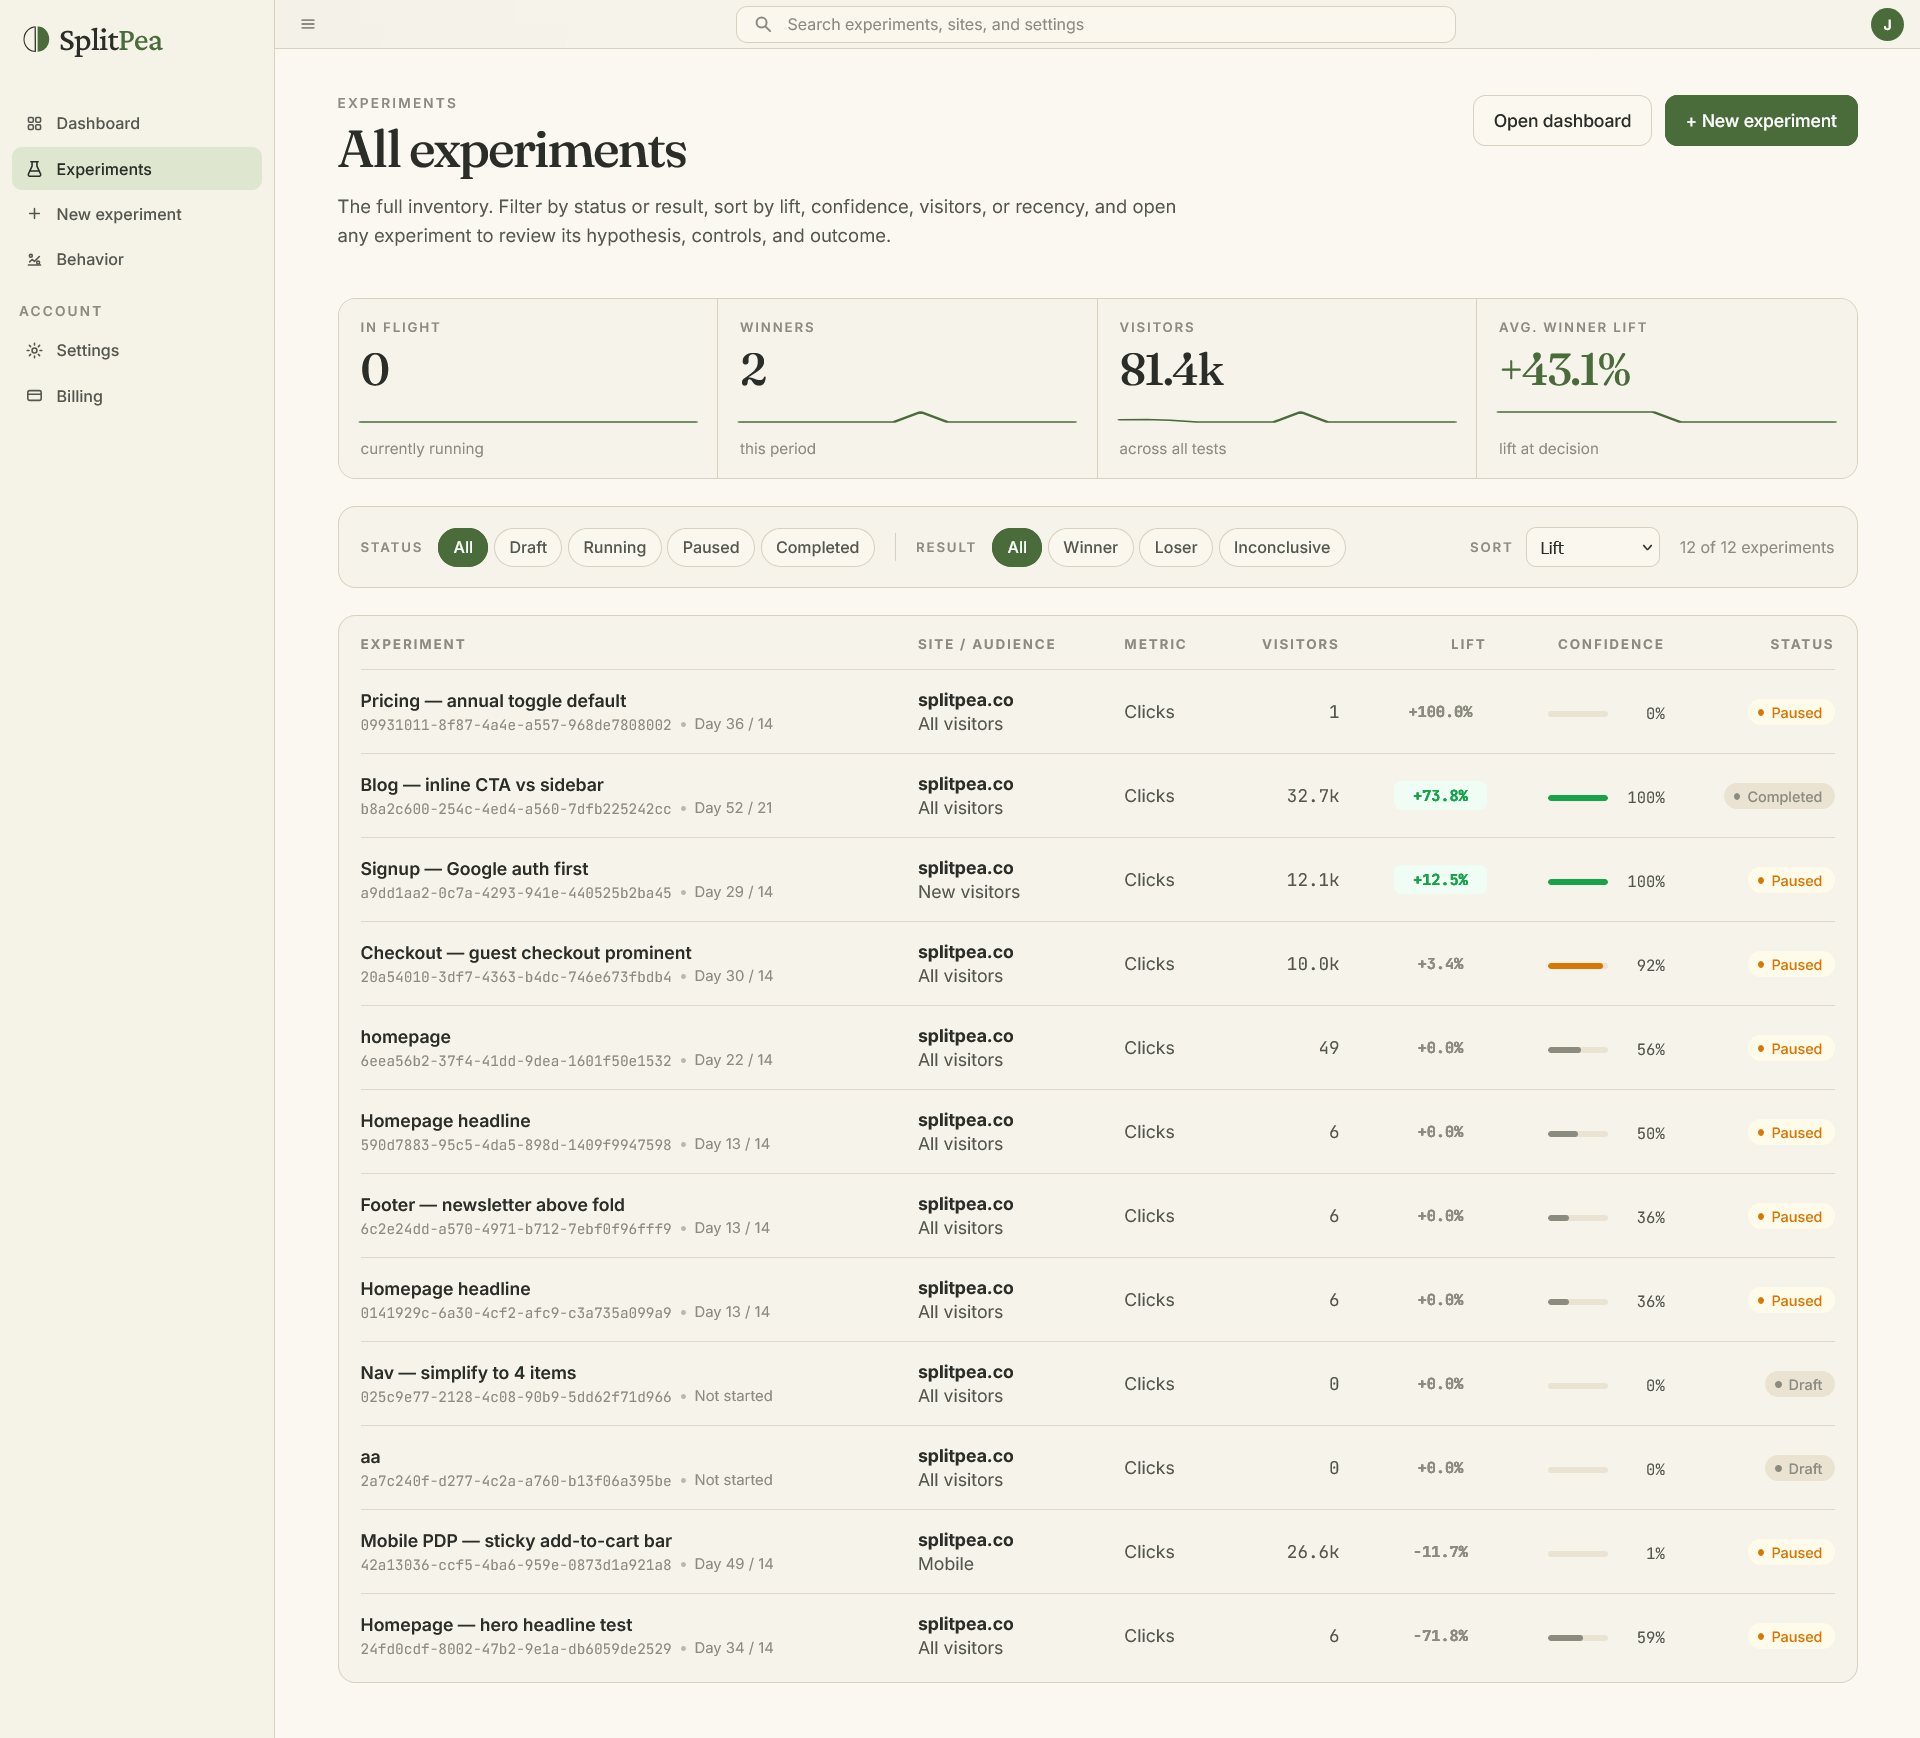
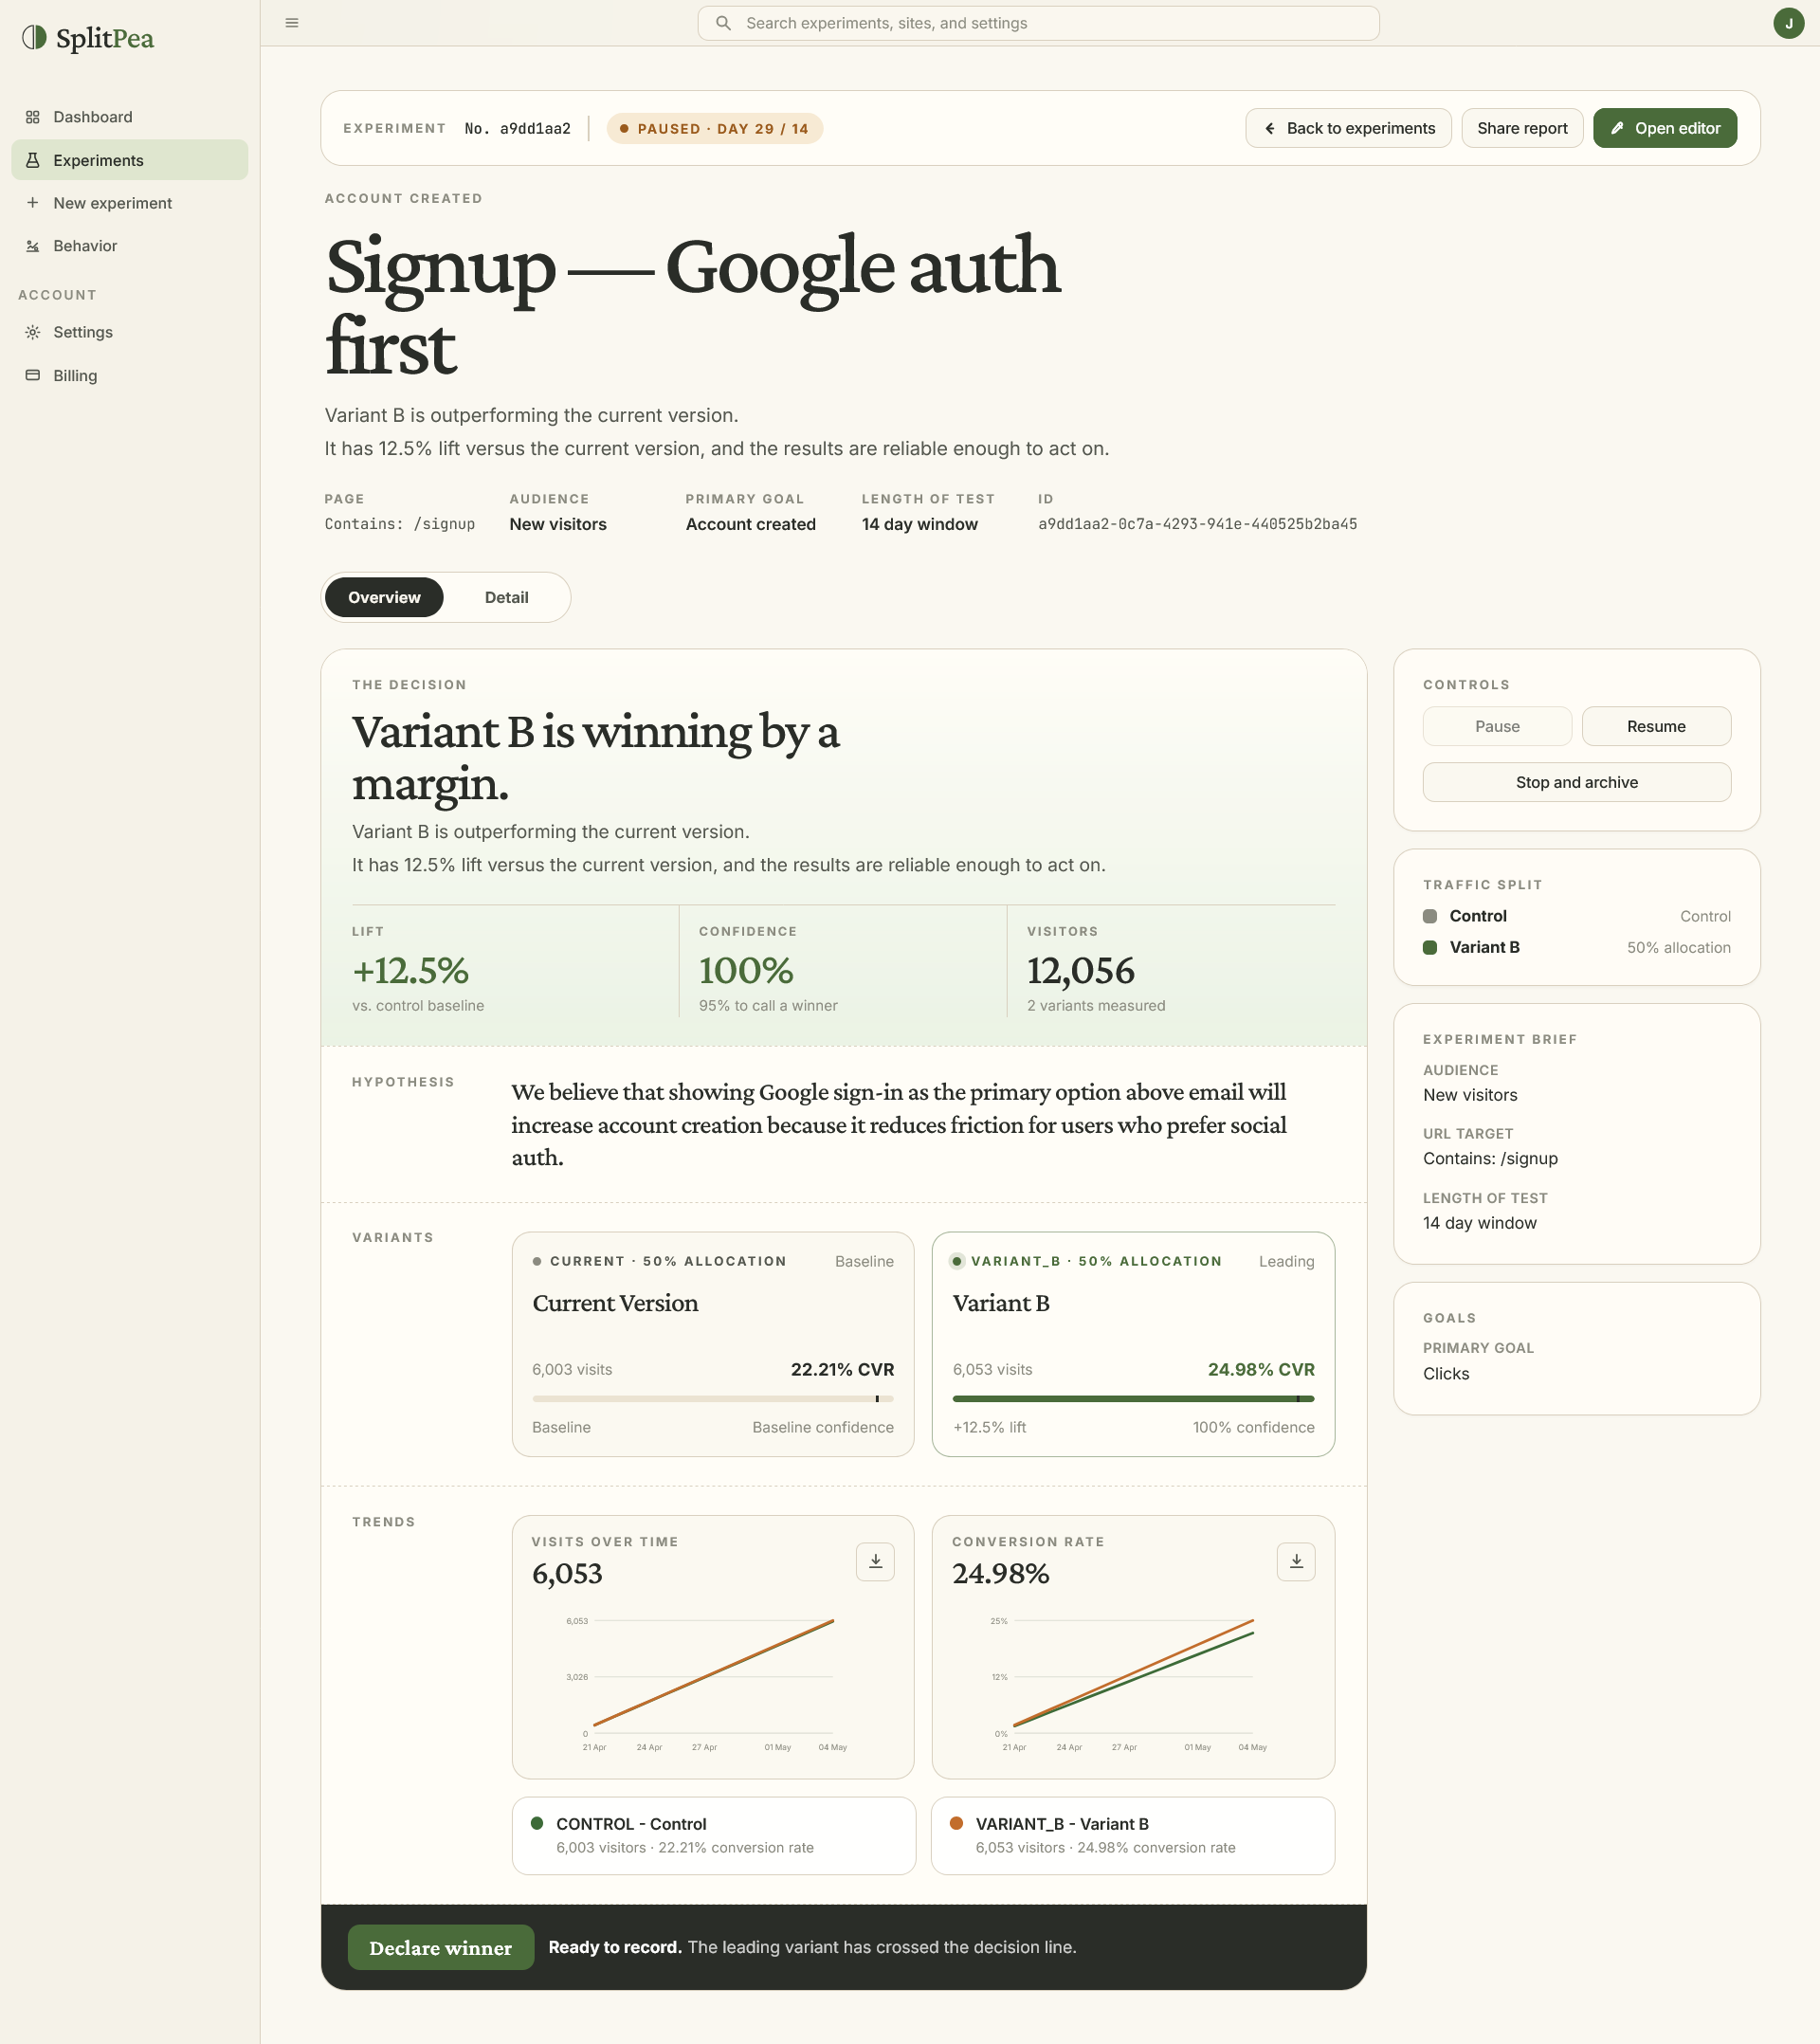
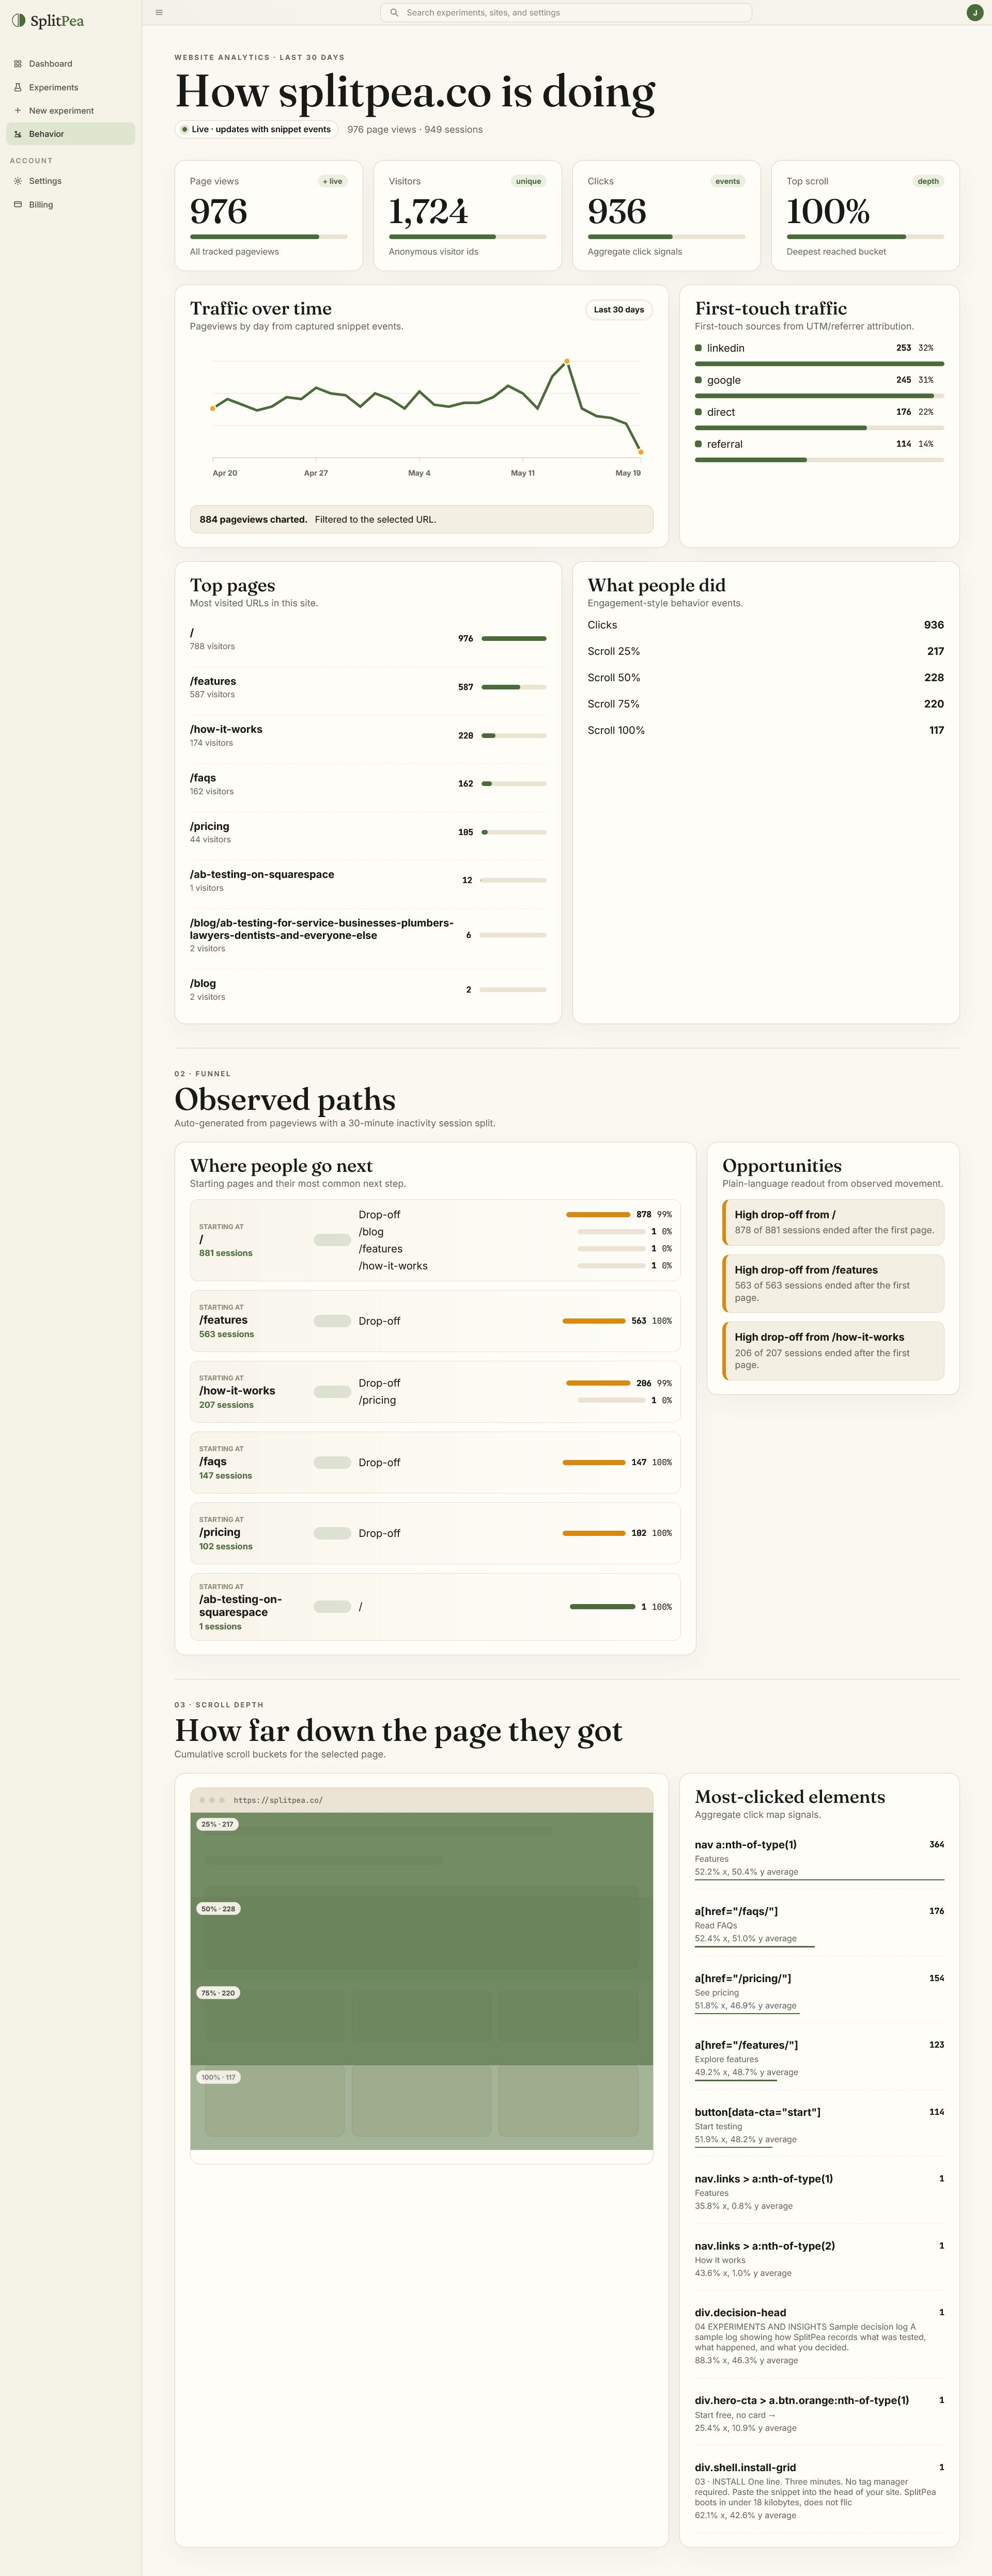
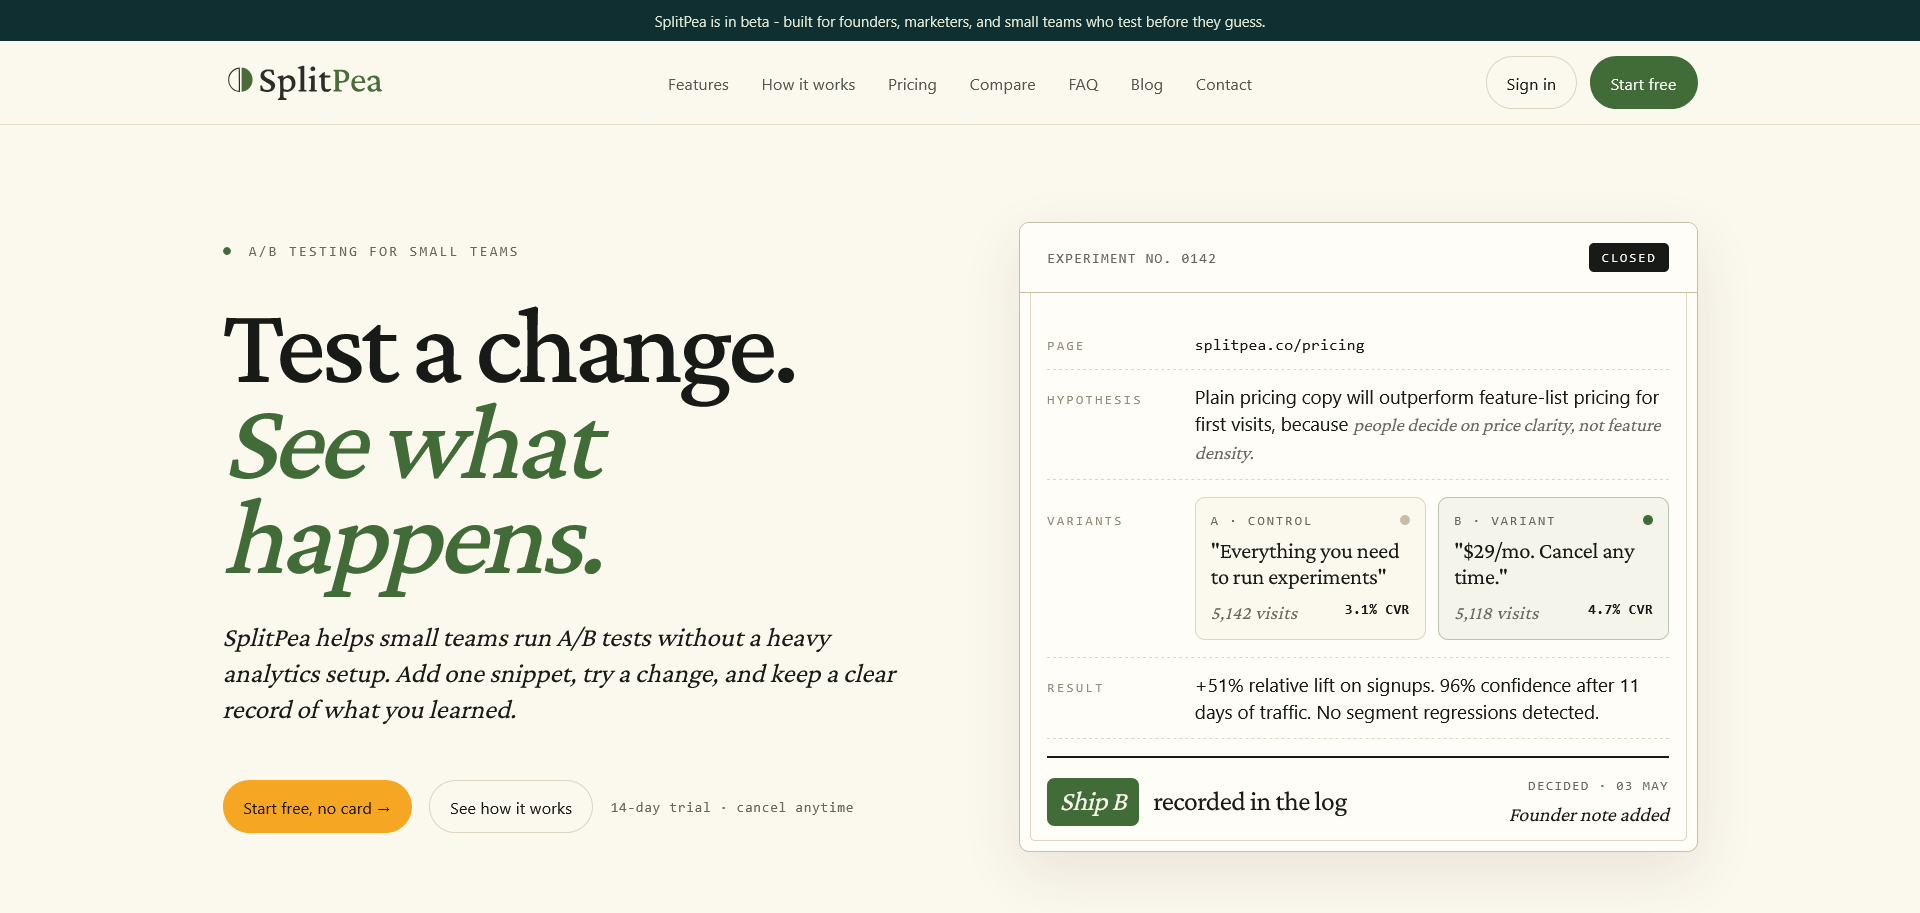
SplitPea (A/B testing SaaS), and a live algorithmic trading platform. Stack: FastAPI, SQLite, HTMX, Codex API. Also taking analytics consulting work alongside product development.
2021 – 2025
Category Executive
BIC
Led commercial and performance analysis across sales, consumer, and market datasets, translating complex data into recommendations for marketing, sales, and leadership teams. Built self-serve dashboards in Excel and Power BI, and developed the business case that helped reverse a key product range from -48% decline to +18% growth.
2018 – 2021
Category Insights Analyst
Bakers Delight
Helped build the reporting infrastructure behind a 700+ location network, working with data engineers on databases, Sisense dashboards, and automated reporting. Developed analytical models across pricing, promotions, and performance data, and turned multi-source data into practical recommendations for operational and regional teams.
2015 – 2018
Client Service Executive → Senior Client Service Executive
Nielsen
Built my analytical foundation working across large retail and consumer datasets, helping major clients interpret performance, data methodology, and market trends. Delivered recurring and ad hoc analysis, translating complex data into clear recommendations for non-technical stakeholders.
2011 – 2015
Bachelor of Commerce (Marketing, Statistics)
Bachelor of Information Systems
Deakin University
Python SQLite FastAPI HTMX
Trading Performance
Overview
Full-stack analytics platform built to measure and improve trading performance over time. Tracks P&L, win rates, setup effectiveness, and behavioural patterns through discipline scoring, mental state correlation, setup drift detection, and Monte Carlo projections. Built from scratch in Python using FastAPI, HTMX, and SQLite to answer one question — is the edge real, and am I following it?
Screenshots
Performance Dashboard Edge Trend Weekly Scorecard Projection Module
Python LLM FastAPI
Revisi
Overview
LLM-powered brand voice auditor. Scans a website, checks every page against brand voice metrics, and generates a report with specific recommendations. Built in Python and FastAPI. Uses the Anthropic API for the recommendations layer. Customers paste in a URL and get a per-page audit with prioritised recommendations within a couple of minutes.
Screenshots
Revisi Homepage Revisi Results Revisi Results
Python Plotly Research
Lego Range Review
Overview
Exploratory analysis of Lego’s product range from the 1980s to 2025, combining pricing, product mix, and market context to understand the drivers behind its long-term growth. The analysis found that Lego’s expansion was driven not by a single factor, but by a mix of licensed IP, the adult market, and a premiumisation strategy that significantly increased average price per piece.
Screenshots
Lego - Slide 3 Lego - Slide 4 Lego - Slide 5 Lego - Slide 6 Lego - Slide 7 Lego - Slide 8 Lego - Slide 9 Lego - Slide 10 Lego - Slide 11
JavaScript Public Data Data Visualisation
LGA Language Explorer
Overview
Australian census geography changes between editions - suburbs split, LGAs merge, boundaries shift - which makes direct trend comparison unreliable. I rebuilt the data from SA1 level using ABS correspondence files to harmonise 2011, 2016, and 2021 onto consistent 2021 boundaries, then added a 2026 projection layer. The result covers 8,465 suburbs across 540 LGAs with consistent time-series data on languages spoken at home. The full methodology is written up in the blog post.
Screenshots
Language Explorer
Python FastAPI A/B Testing
SplitPea
Overview
SplitPea is an A/B testing and website analytics platform with a lightweight snippet and easy-to-use visual editor. Most A/B testing platforms cost $200-$300/month and require a developer to set up. SplitPea is built to be easy to install (one line snippet), easy to use (visual editor, no code), and affordable for small businesses (starts at $29/month).
Screenshots
SplitPea SplitPea SplitPea SplitPea