The analysis looks at Lego's product range from the 1980s to 2025 to separate nostalgia from measurable drivers: licensed IP, adult-oriented sets, pricing, and range architecture.
01 - The problem
Growth stories get vague when product mix changes over decades
Lego's growth is often explained through brand affection alone. The useful question is more specific: how did range shape, price architecture, licensing, and adult-market expansion change the business?
02 - What I built
A visual range review from raw catalogue data
I structured the analysis around year-by-year releases, average pieces, RRP, price per piece, licensed share, and adult-product growth, then converted the findings into an executive-style deck.
03 - Walkthrough
From catalogue rows to strategic signals
04 - Outcomes
Key findings from the data
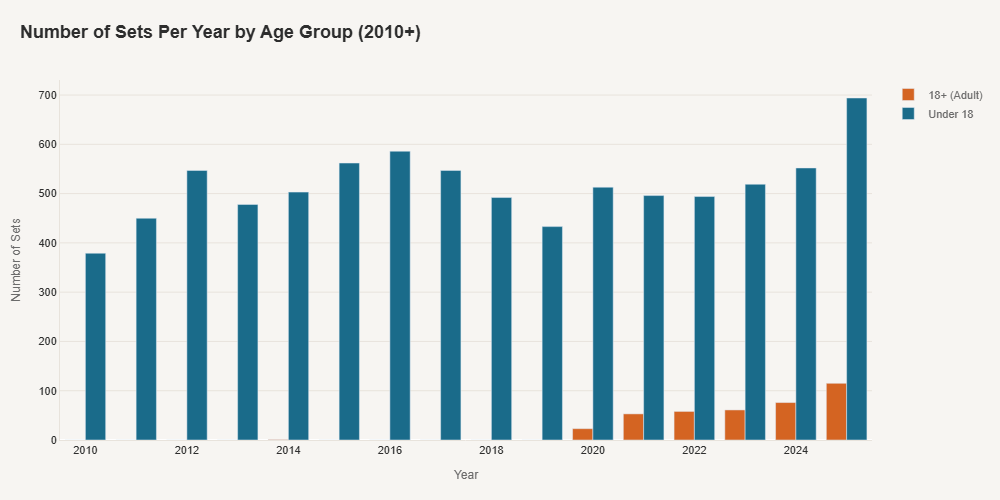
through 2025 range history
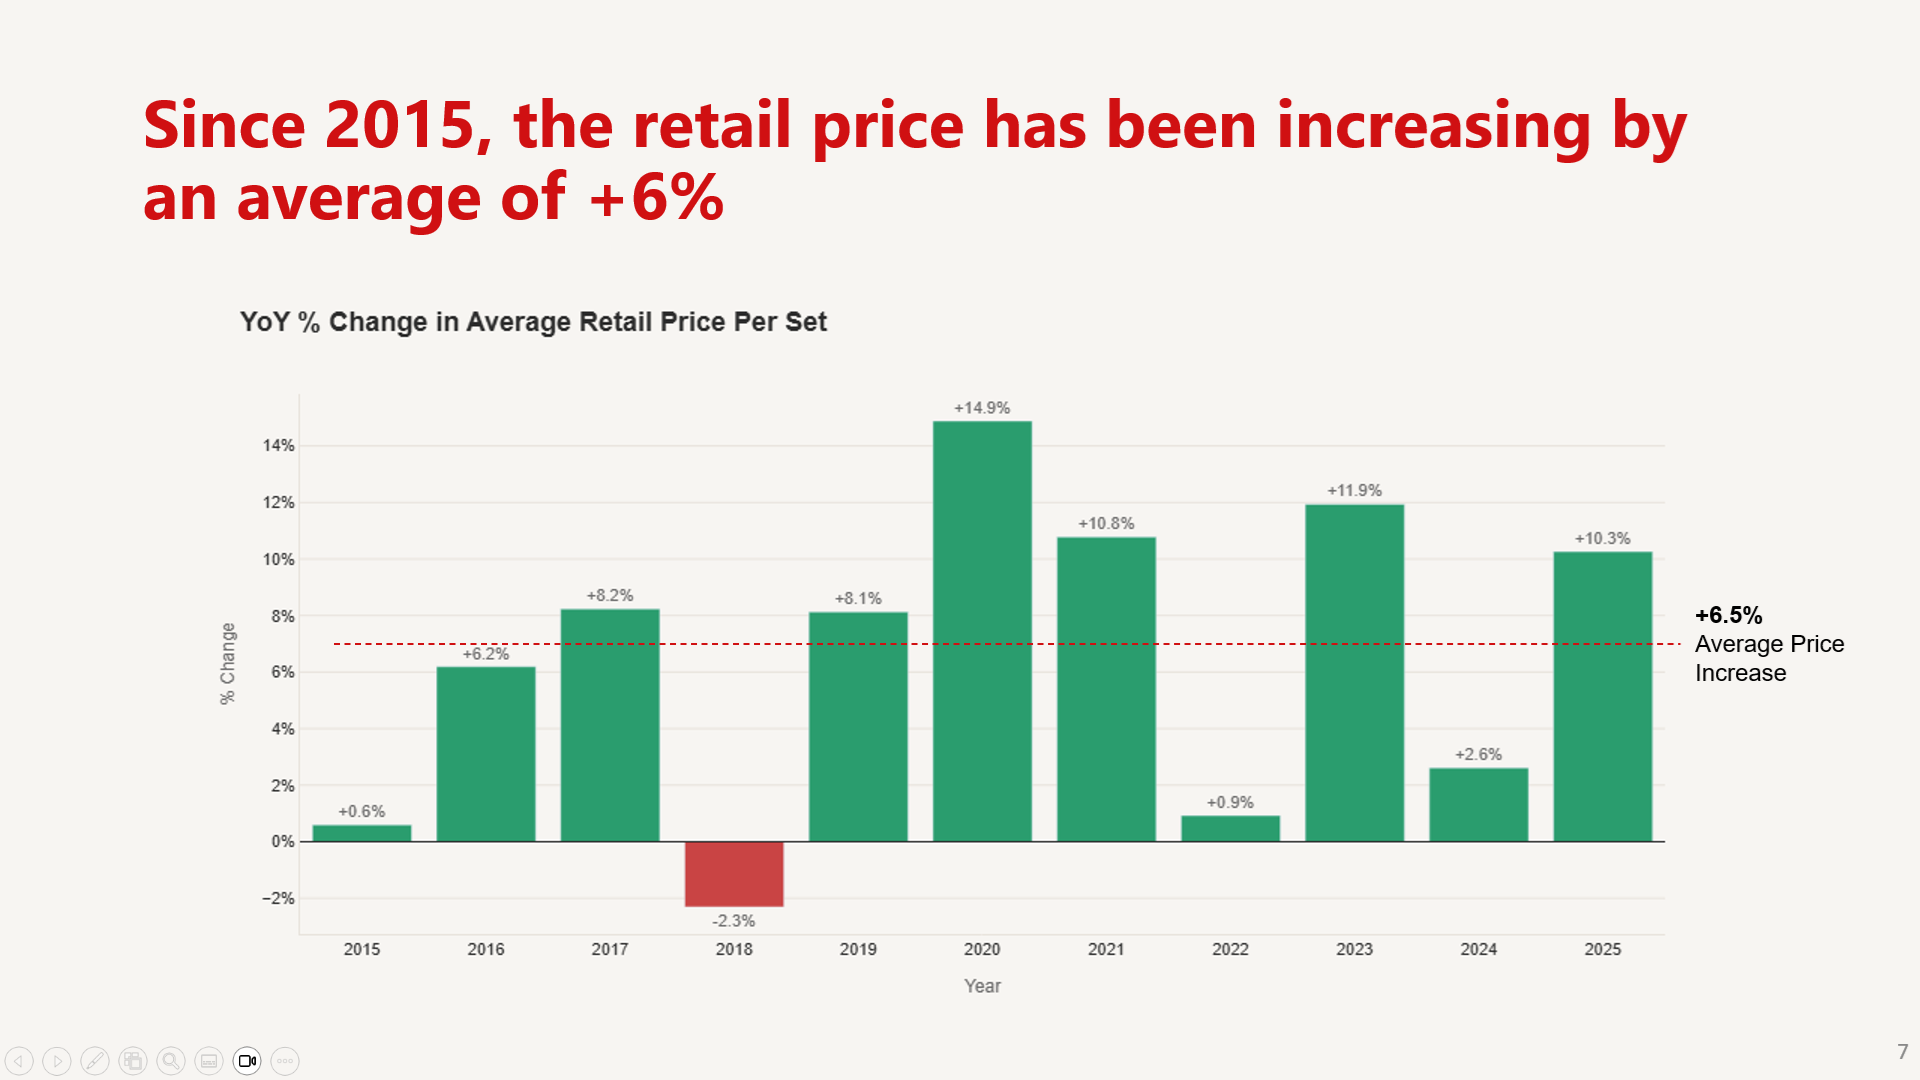
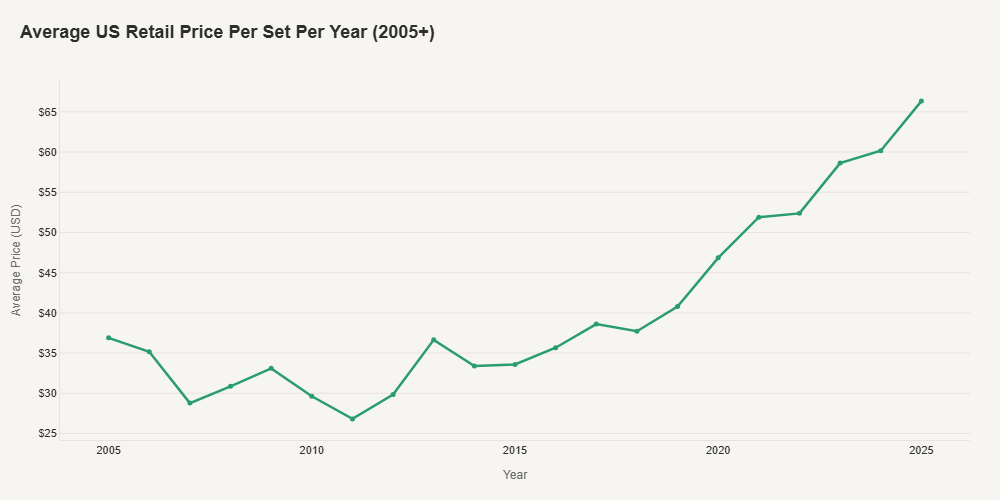
and value metrics normalised by piece count
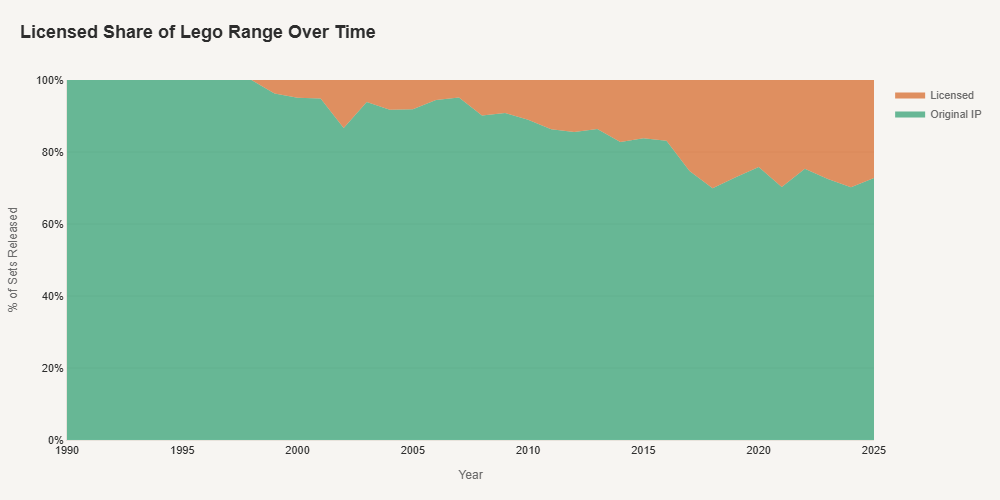
licensed share isolated as a driver
visual story for commercial review