This is the third city in the multi-city census series. The methodology piece described how I harmonised ABS census data across three editions onto consistent 2021 boundaries. Previous editions covered Melbourne and Sydney.
Brisbane's demographics is structurally different from Melbourne and Sydney. It's a city still anchored by English-speaking migration, for example New Zealand and England dominate the population born overseas, but there's been some rapid diversification from other countries such as India and China, and a secular shift has ovetaken Christianity.
Birthplace: England holds, but India and China are catching up
In the top three birthplaces, India has had a strong growth trajectory compared to England and New Zealand. Brisbane's population is growing at roughly 2.1%, and people born in New Zealand and India have grown faster than the average population.
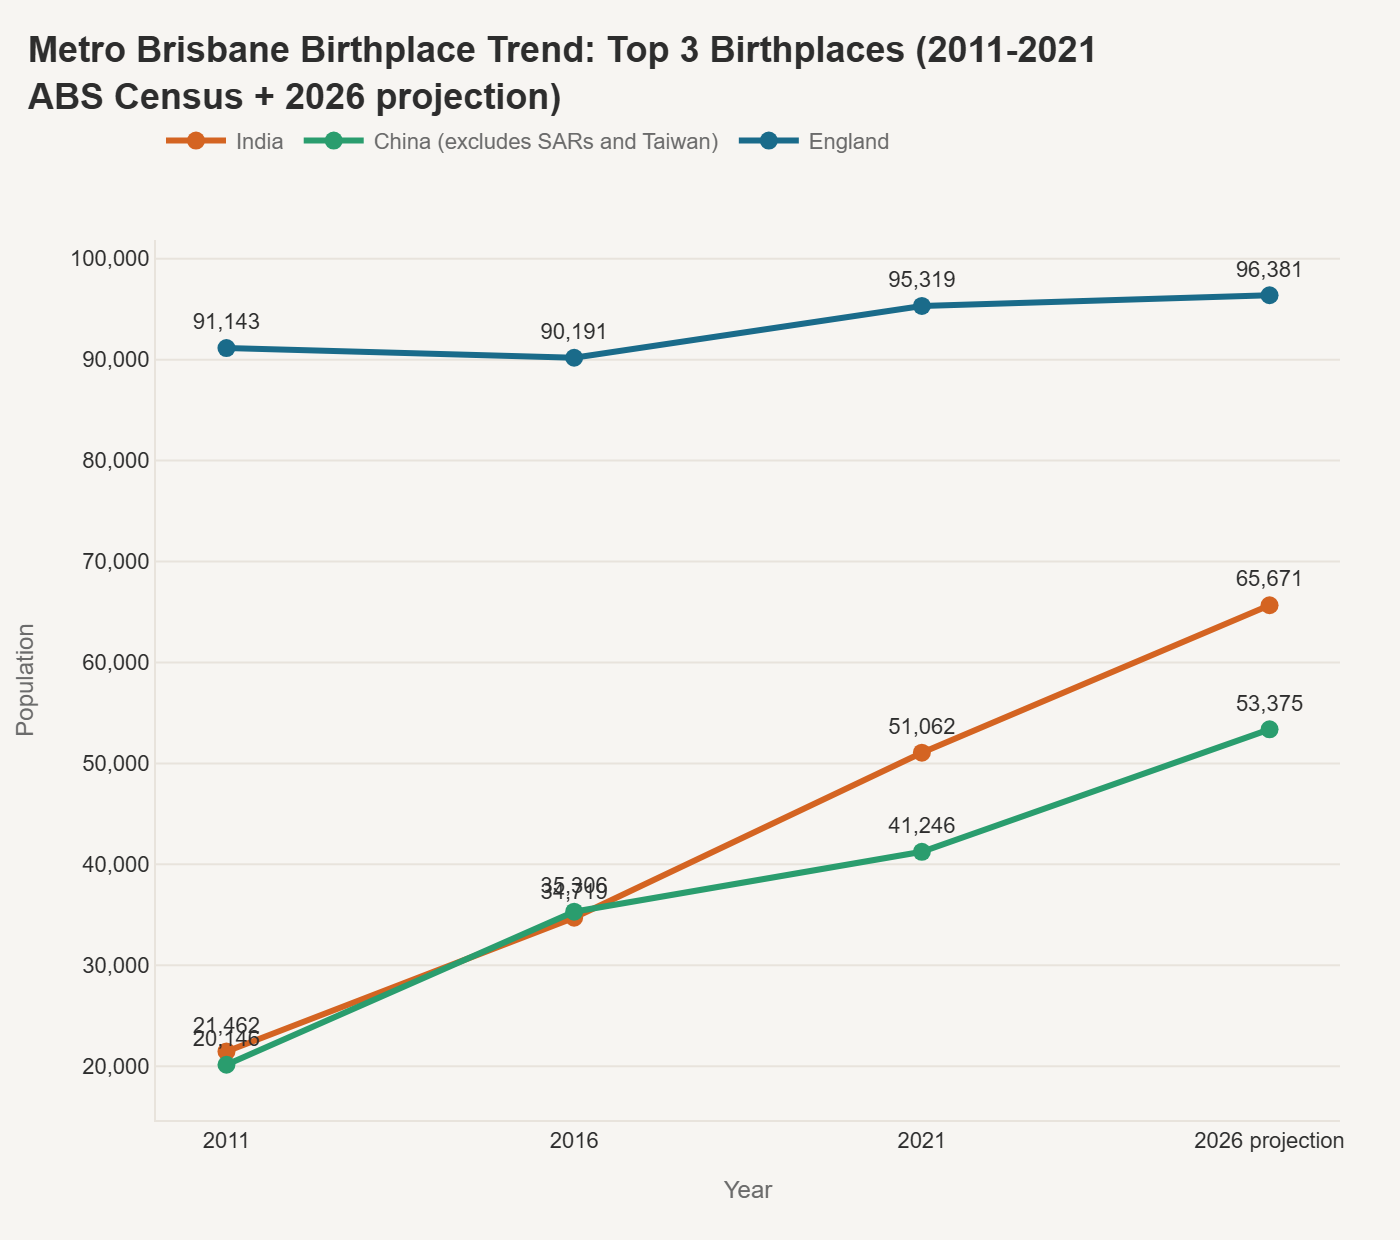
In 2011, England led at 91,000 with India and China nearly tied at around 21,000 each. By 2016, both had grown to roughly 35,000 while England dipped slightly to 90,000. By 2021, India had pulled ahead of China at 51,000 vs 41,000, with England edging up to 95,000.
The 2026 projection puts India at 66,000 and China at 53,000, with England essentially flat at 96,000. India's trajectory is the steepest - it's added roughly 30,000 people across the decade and is projected to close to within 30,000 of England by 2026. If the trend holds, India will likely overtake England as Brisbane's largest overseas-born population within the next census cycle or two.
What stands out is that England hasn't declined in Brisbane the way it has stagnated in other capitals. It's held remarkably steady around 90,000–96,000 across the entire period. Brisbane continues to attract British migrants in a way that Sydney in particular does not.
Brisbane's birthplace mix vs other metro cities
This is where Brisbane's demographic identity comes into sharpest focus.
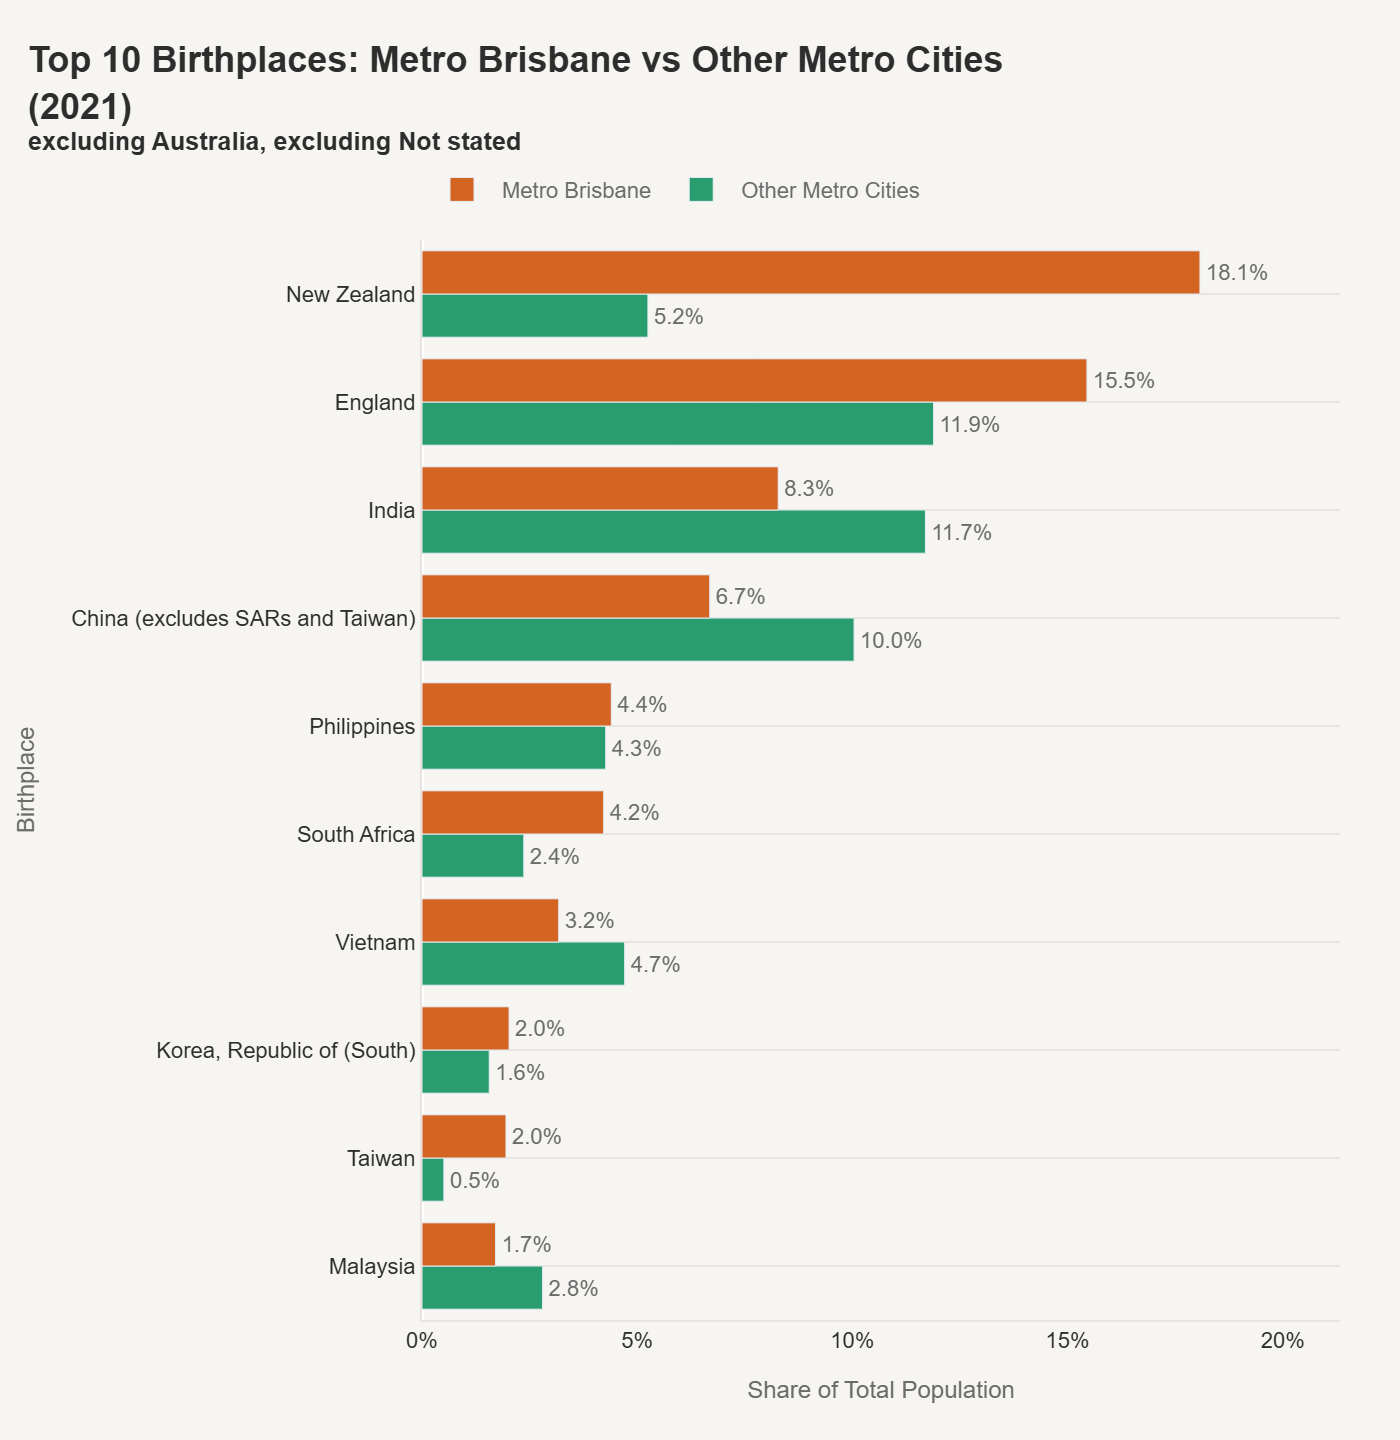
New Zealand is Brisbane's largest overseas-born group at 18.1%, compared to just 5.2% in other metro cities. That's a 3.5x over-representation and it's not close to matching anywhere else in the country. England is second at 15.5% (vs 11.9% nationally). Together, these two English-speaking sources account for over a third of Brisbane's overseas-born population.
South Africa is another distinctive Brisbane signature at 4.2% vs 2.4% nationally, and Taiwan appears in Brisbane's top 10 at 2.0% vs 0.5% - a 4x over-representation that doesn't feature prominently in any other major Australian metro.
The flip side: Brisbane under-indexes significantly on India (8.3% vs 11.7%), China (6.7% vs 10.0%), and Vietnam (3.2% vs 4.7%). These are the communities driving demographic change in the southern capitals, and while they're growing fast in Brisbane too, they're starting from a much smaller base.
Brisbane vs Regional Queensland
The metro-to-regional comparison in Queensland is different from NSW and Victoria. The gap between Brisbane and Regional QLD is narrower in some respects.
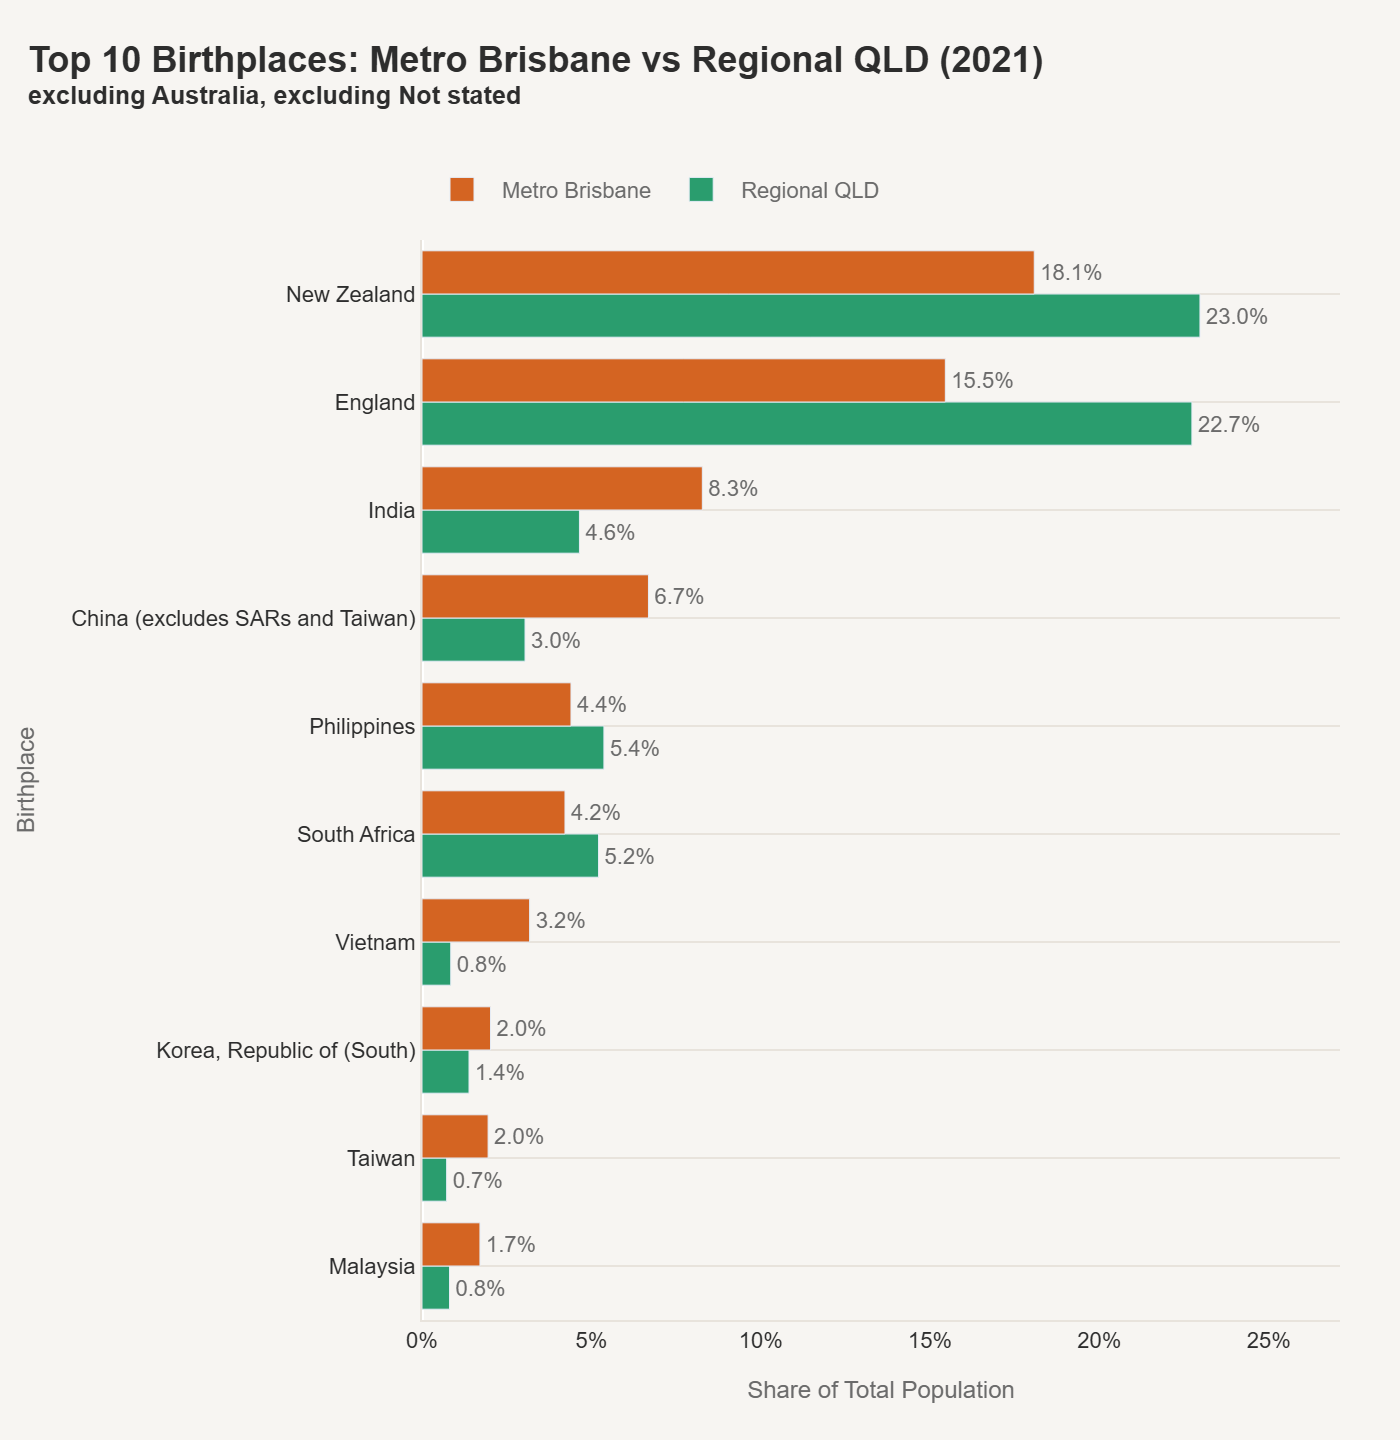
Regional Queensland's overseas-born population is even more concentrated in NZ and England than Brisbane's. New Zealand leads at 23.0% and England at 22.7% - together accounting for nearly half of the regional overseas-born population. South Africa is also proportionally stronger regionally (5.2% vs 4.2%), as are the Philippines (5.4% vs 4.4%).
India and China drop sharply: India from 8.3% metro to 4.6% regional, China from 6.7% to 3.0%. Vietnam nearly disappears at 0.8% regionally.
One interesting pattern: the Philippines holds and even grows its share outside Brisbane, similar to what we see in Regional NSW. This likely reflects the same healthcare and agricultural worker settlement pipelines. South Africa's regional strength may reflect mining and resources sector settlement in Central and North Queensland.
Language: Mandarin leads, Samoan is the signature
Brisbane's language profile reflects its birthplace composition - heavily English-speaking, with emerging Asian language communities.
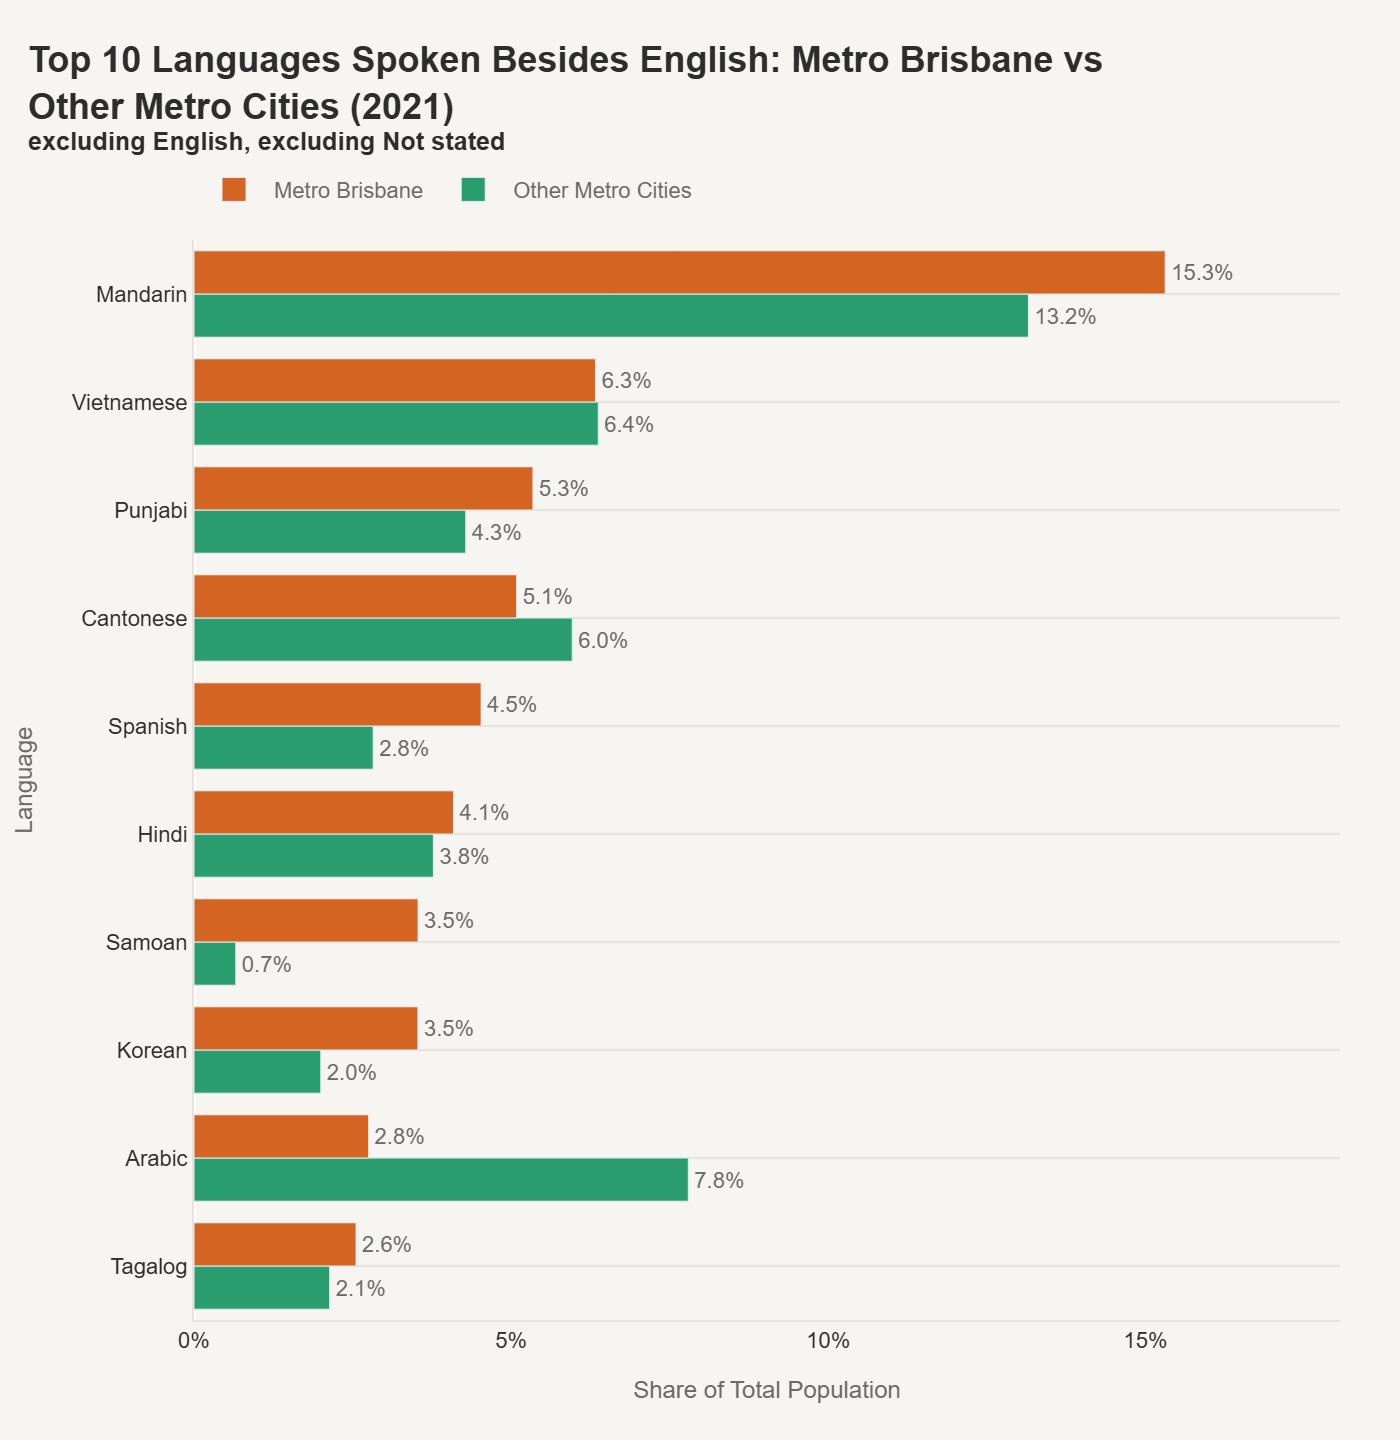
Mandarin leads at 15.3%, notably higher than the 13.2% across other metro cities - an interesting result given that Brisbane's China-born share is actually lower than the national metro average. This suggests either a broader Mandarin-speaking population beyond mainland Chinese migrants (Taiwan's over-representation supports this), or generational language retention playing out differently in Brisbane.
The most distinctively Brisbane language is Samoan at 3.5% vs 0.7% in other metros - a 5x over-representation. This reflects Brisbane's role as a Pacific Island migration hub, drawing from both Samoa and the broader Pasifika diaspora. It's a demographic signature that doesn't register in any other Australian capital's top 10.
Spanish is also elevated (4.5% vs 2.8%), as is Korean (3.5% vs 2.0%). Arabic, by contrast, is notably low at 2.8% vs 7.8% in other metros - essentially the inverse of Sydney's pattern. Cantonese is also below the national average (5.1% vs 6.0%).
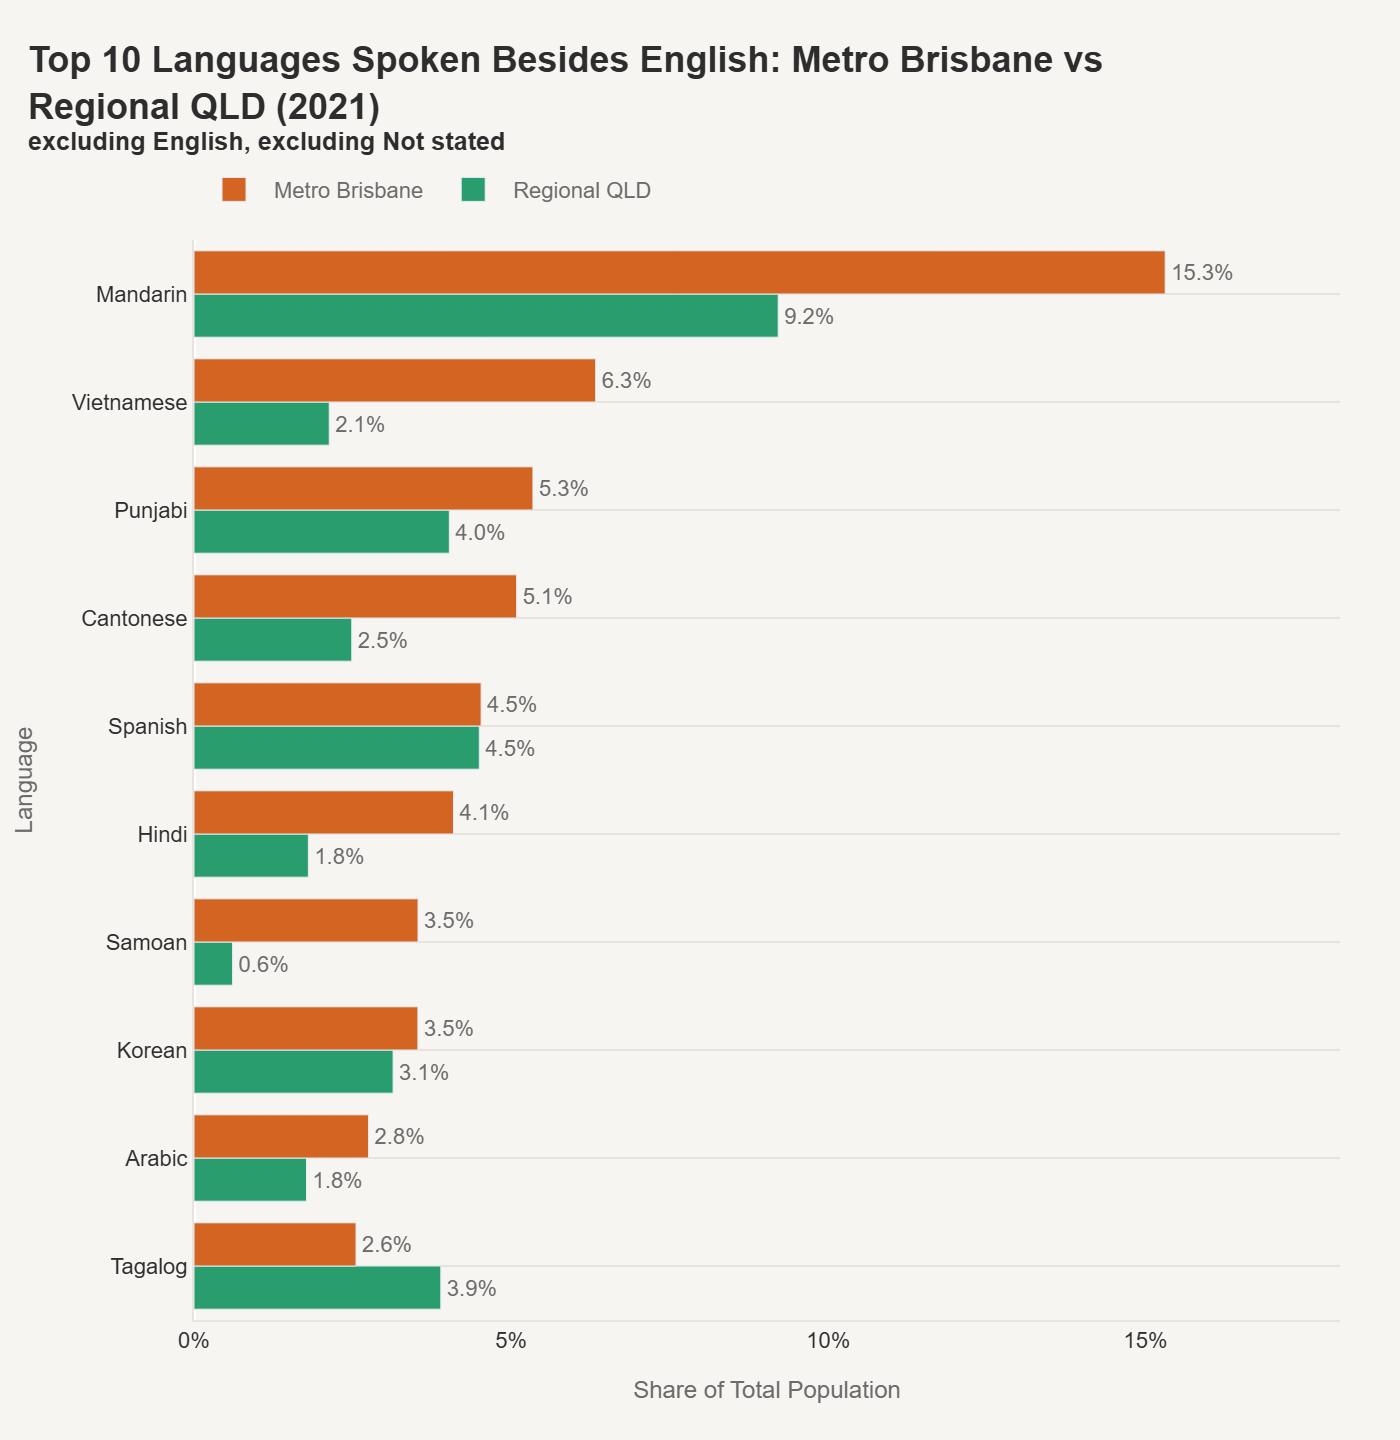
The regional language picture is notably flatter than in other states. Mandarin drops from 15.3% to 9.2% - still the largest non-English language but not by the same margin. Spanish holds exactly even at 4.5% metro and regionally. Tagalog actually grows from 2.6% in Brisbane to 3.9% regionally, likely reflecting Filipino settlement in agricultural and mining regions across Queensland. Korean also holds relatively well (3.5% to 3.1%).
Punjabi's regional presence at 4.0% (vs 5.3% metro) is stronger than you might expect, likely reflecting agricultural sector settlement similar to patterns seen in Regional Victoria. Vietnamese drops sharply from 6.3% to 2.1%.
Religion: The crossover has already happened
This is the most notable finding in the Brisbane data. Brisbane has already crossed the secular–Christian threshold - and it happened earlier than in most other capitals.
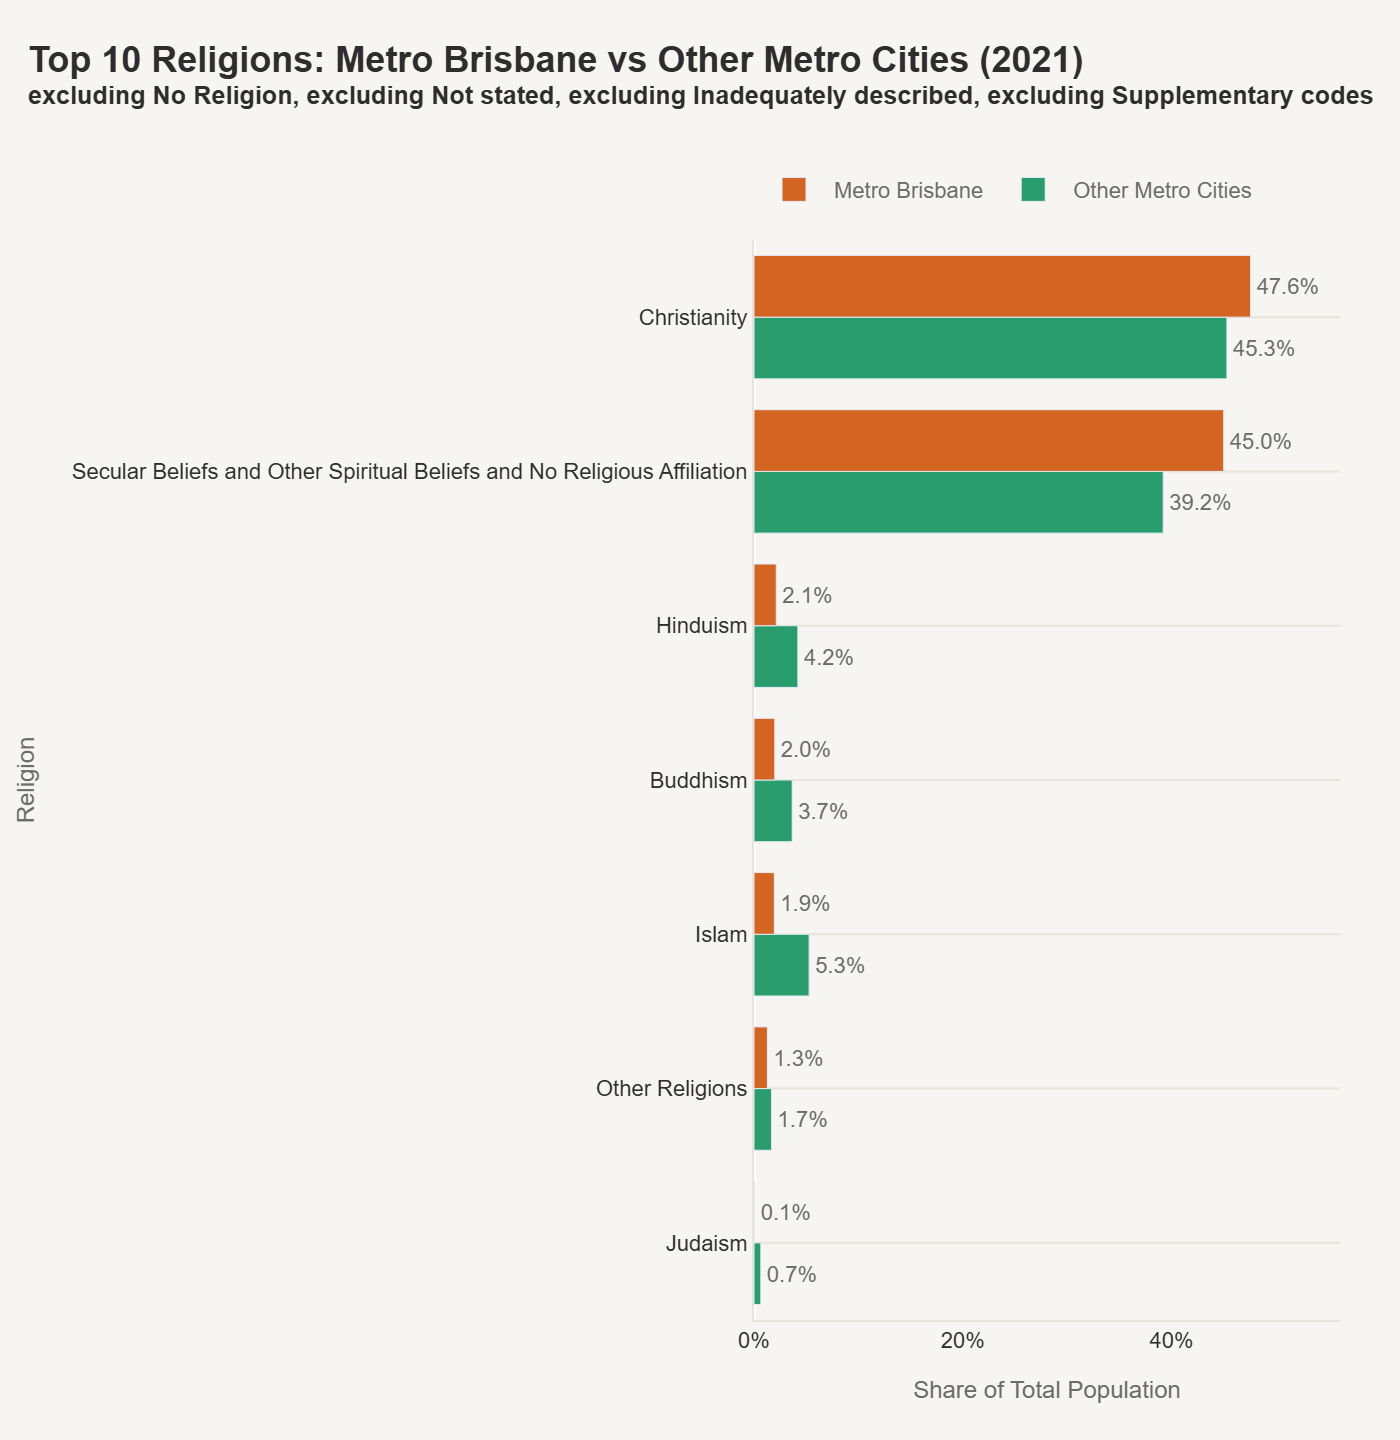
Secular beliefs sit at 45.0% in Metro Brisbane, compared to 39.2% in other metro cities. Christianity is at 47.6% vs 45.3%. The gap between the two is just 2.6 percentage points - and the trend chart shows the lines have essentially already crossed.
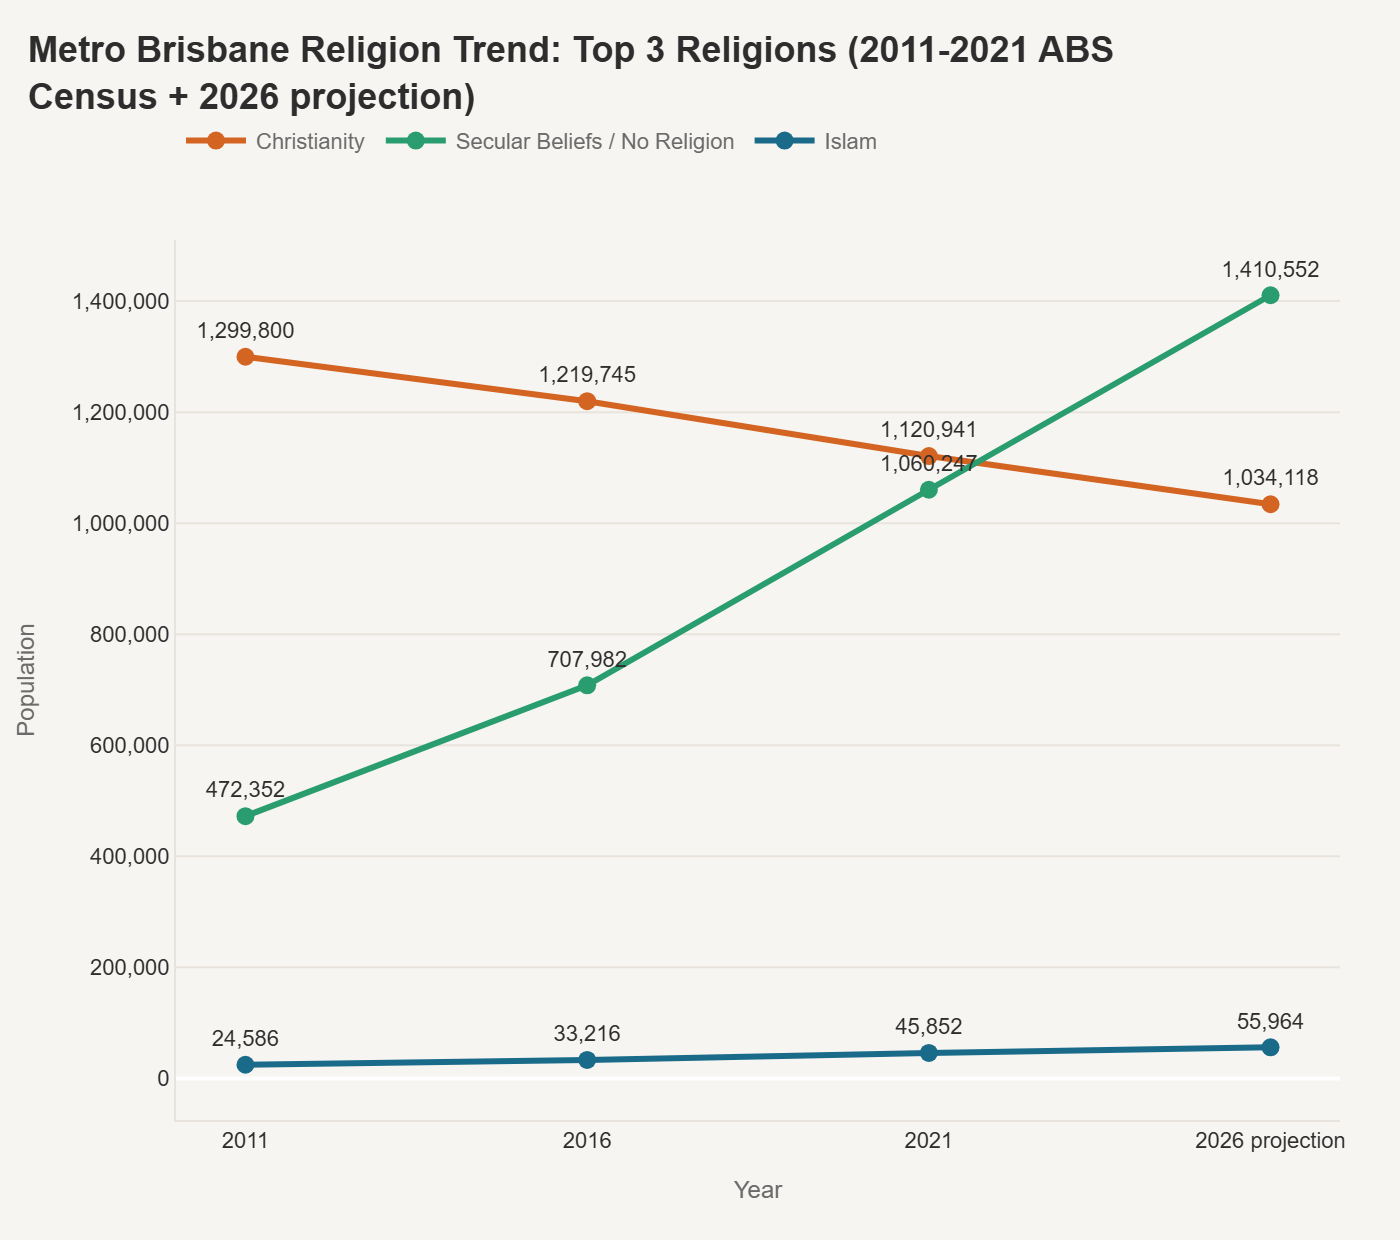
The trend is clear. Christianity dropped from 1.30 million in 2011 to 1.12 million in 2021, projected at 1.03 million by 2026. Secular beliefs surged from 472,000 to 1.06 million over the same period - more than doubling - and are projected to reach 1.41 million by 2026. The crossover happened between 2016 and 2021, and the projection shows the gap widening rapidly.
What makes Brisbane's secular shift distinctive is what's absent. Islam (1.9%), Hinduism (2.1%), and Buddhism (2.0%) are all roughly half their share in other metro cities (5.3%, 4.2%, and 3.7% respectively). Brisbane doesn't have the large religiously observant migrant communities that slow the secular transition in cities like Sydney. The migration mix - dominated by NZ and England, with growing but still smaller South and East Asian communities - means there's less of a counterweight to the secular trend among Australian-born residents.
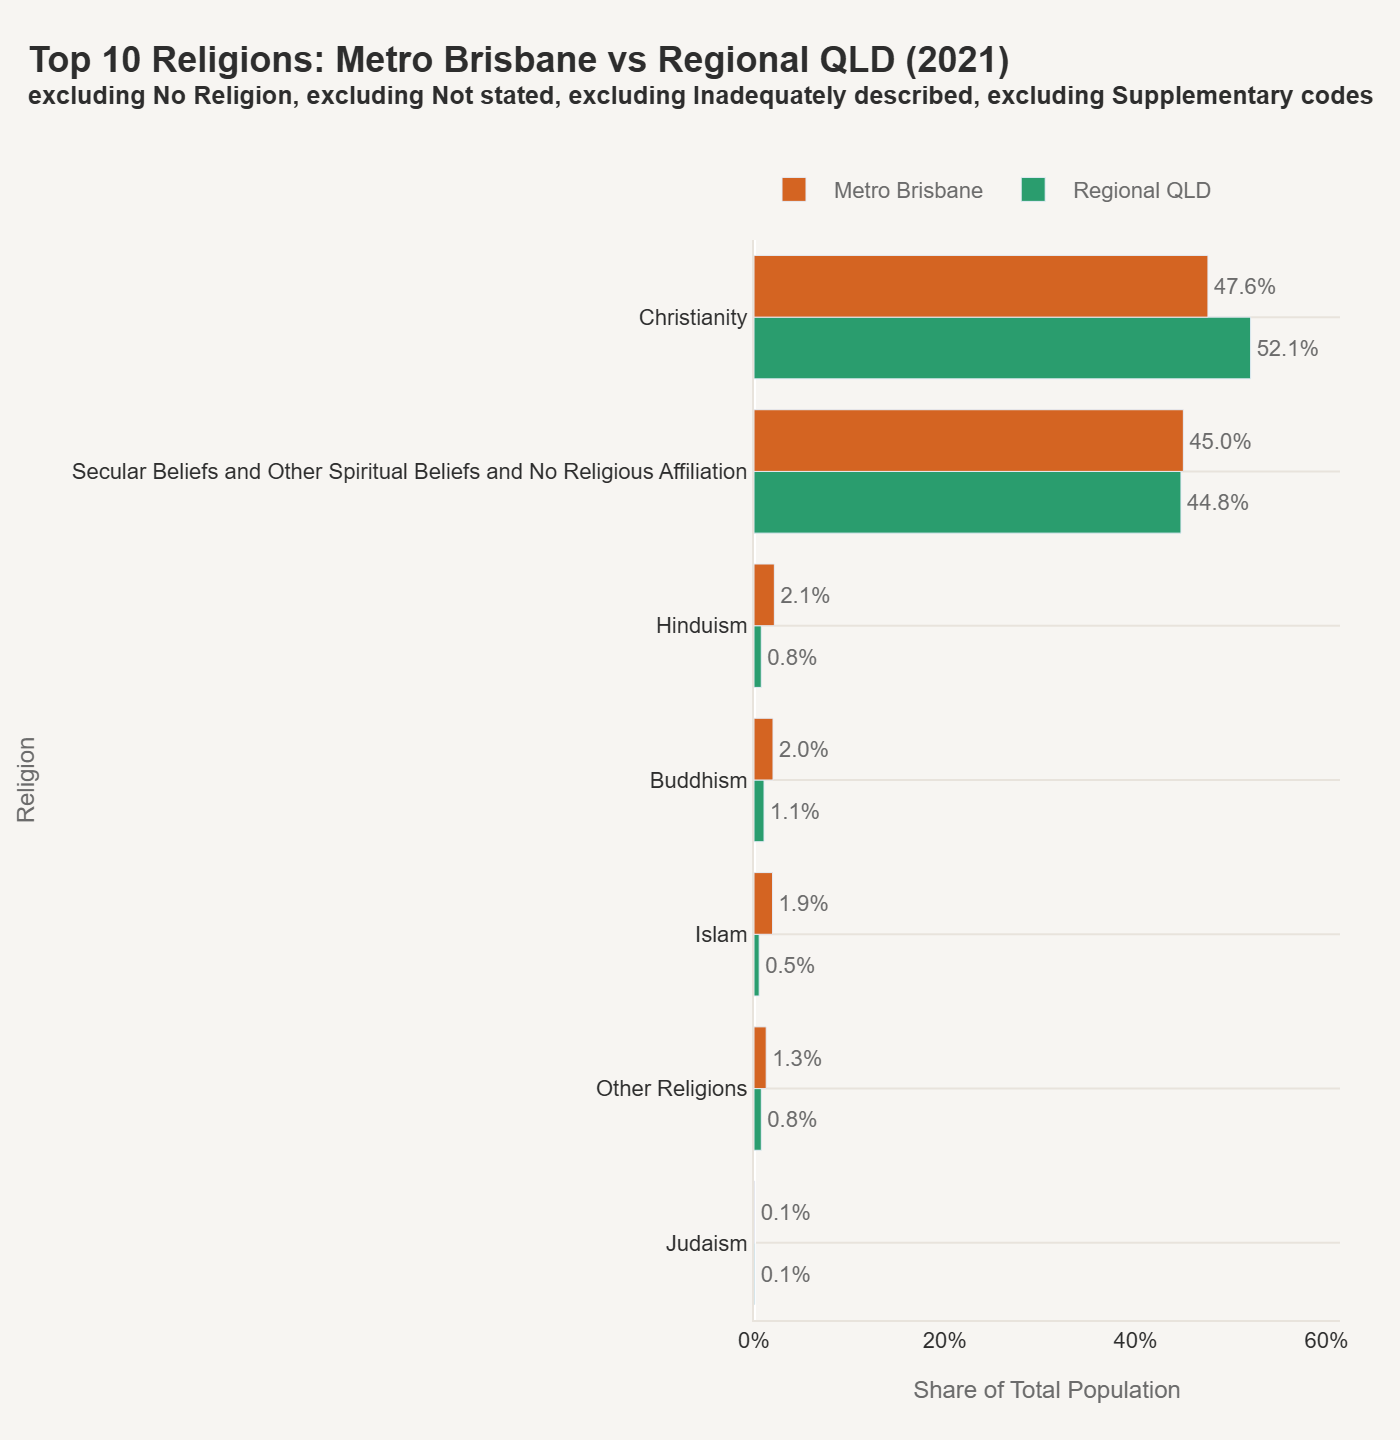
Regional Queensland is more Christian (52.1%) but remarkably close on secular beliefs (44.8% vs 45.0% metro). That near-parity is unusual - in NSW and Victoria, there's a much wider gap between the metro and regional secular share. Queensland's secular shift appears to be a state-wide phenomenon rather than a metro-only one.
Hinduism (0.8%), Buddhism (1.1%), and Islam (0.5%) are essentially absent regionally.
What this doesn't tell you
Census data captures who lives where and what they report on the form. It doesn't capture the lived experience of those communities - how connected or isolated people feel, whether services are adequate, or how identity evolves between generations.
The 2026 projections are linear extensions of 2011–2021 trends. They're useful as a direction indicator but shouldn't be treated as forecasts. Brisbane's rapid population growth - particularly through interstate migration from Sydney and Melbourne - could shift these patterns in ways that a trend extrapolation from census data alone wouldn't capture. A Sydney or Melbourne resident moving to Brisbane brings their demographic characteristics with them but wouldn't show up as an overseas birthplace.
The real value of this dataset is that it provides a consistent, comparable base. When the actual 2026 census data drops, I'll be able to slot it in and see how well the projections held - and where the surprises are.
The methodology piece explains the harmonisation approach. Previous editions cover Melbourne and Sydney.
If you'd like to explore suburb-level or LGA data, I've created a dashboard here.