This is the second city in the multi-city census series. The methodology piece described how I harmonised ABS census data across three editions onto consistent 2021 boundaries. The Melbourne edition was first. This is Sydney.
Sydney is Australia's largest city and its most established migration gateway. The data tells a story of deep, layered diversity - but also one where the rate of change is accelerating in ways that are reshaping the city's demographic centre of gravity.
Birthplace: China leads, India is closing fast
The headline trend in Sydney's birthplace data is the sustained dominance of China-born residents - but with India on a trajectory that could overtake within the next census cycle.
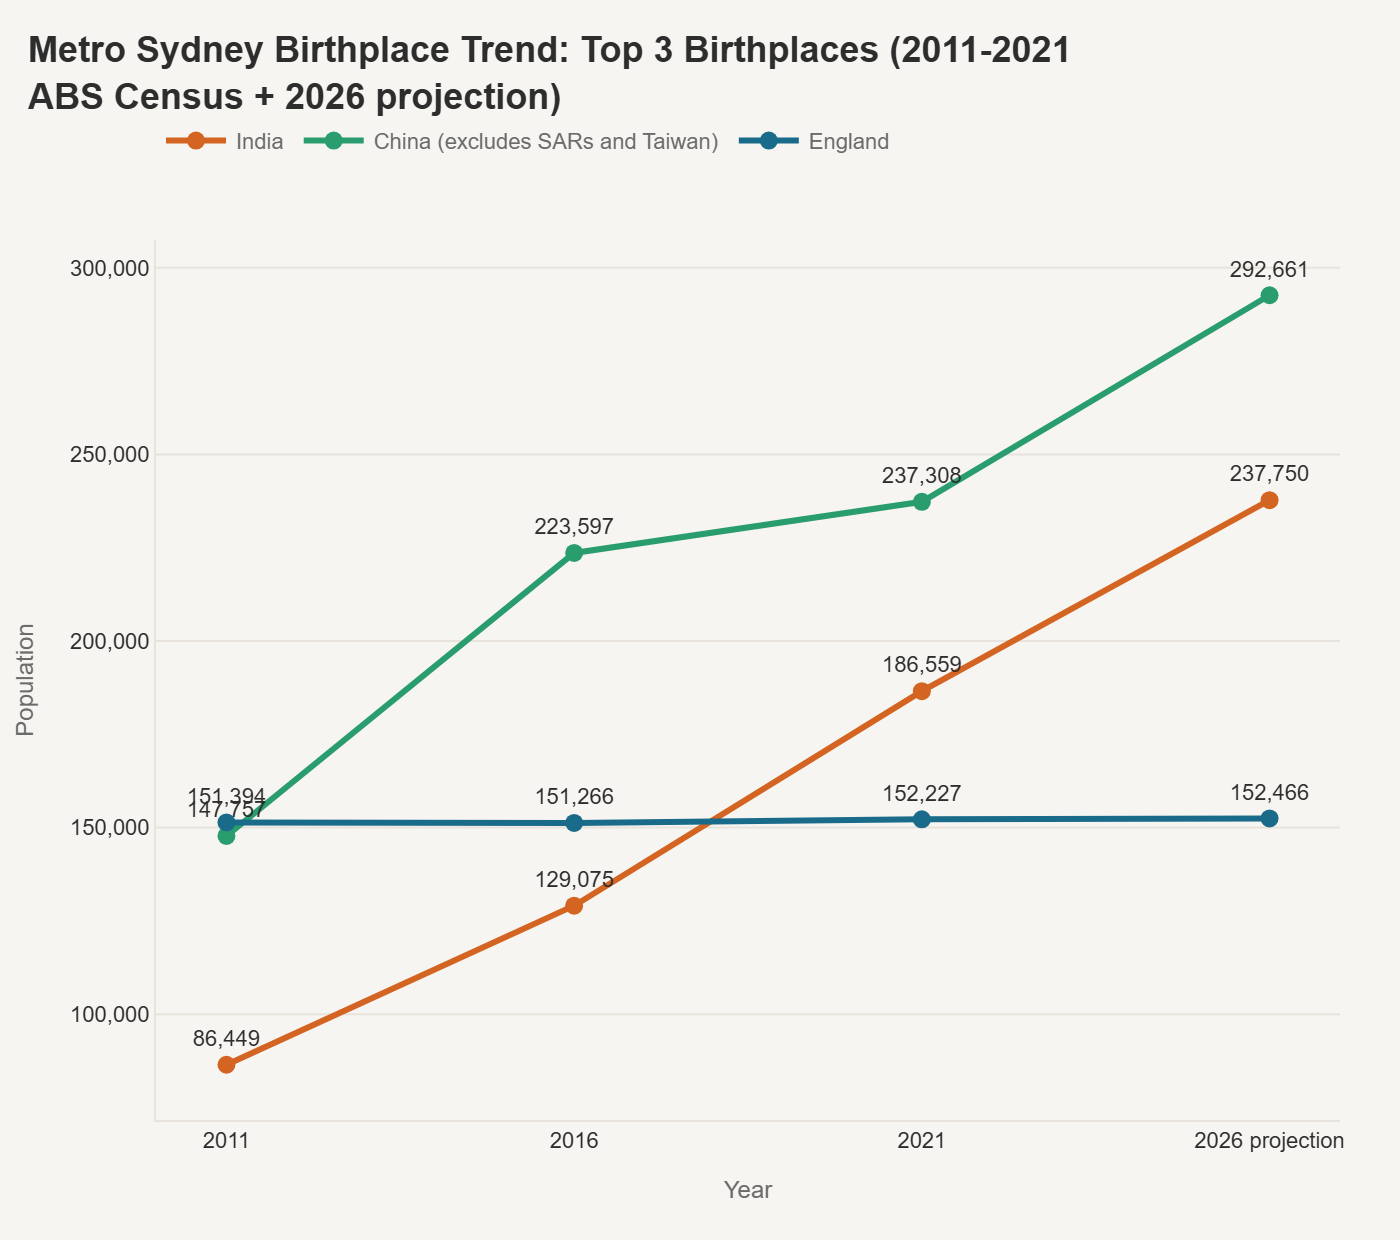
In 2011, England and China were nearly tied at around 151,000 and 148,000 respectively, with India well behind at 86,000. By 2016, China had surged to 224,000 while England barely moved and India reached 129,000. By 2021, China led at 237,000 with India at 187,000 and England static at 152,000.
The 2026 projection puts China at 293,000 and India at 238,000. But look at the slopes - India's growth between 2016 and 2021 was steeper than China's, and the projection suggests the gap will continue to close. England's population has been essentially flat across the entire decade at around 152,000.
China's growth rate is worth watching. The surge between 2011 and 2016 was dramatic - adding roughly 76,000 people - but growth slowed to just 14,000 between 2016 and 2021, likely reflecting tighter migration policy and COVID-era disruption. The 2026 projection assumes the more recent trend continues, but this is one to revisit once actual census data arrives.
Sydney's birthplace mix vs other metro cities
Comparing Sydney's overseas-born profile against other Australian metro cities reveals where Sydney's migration footprint is distinctive.
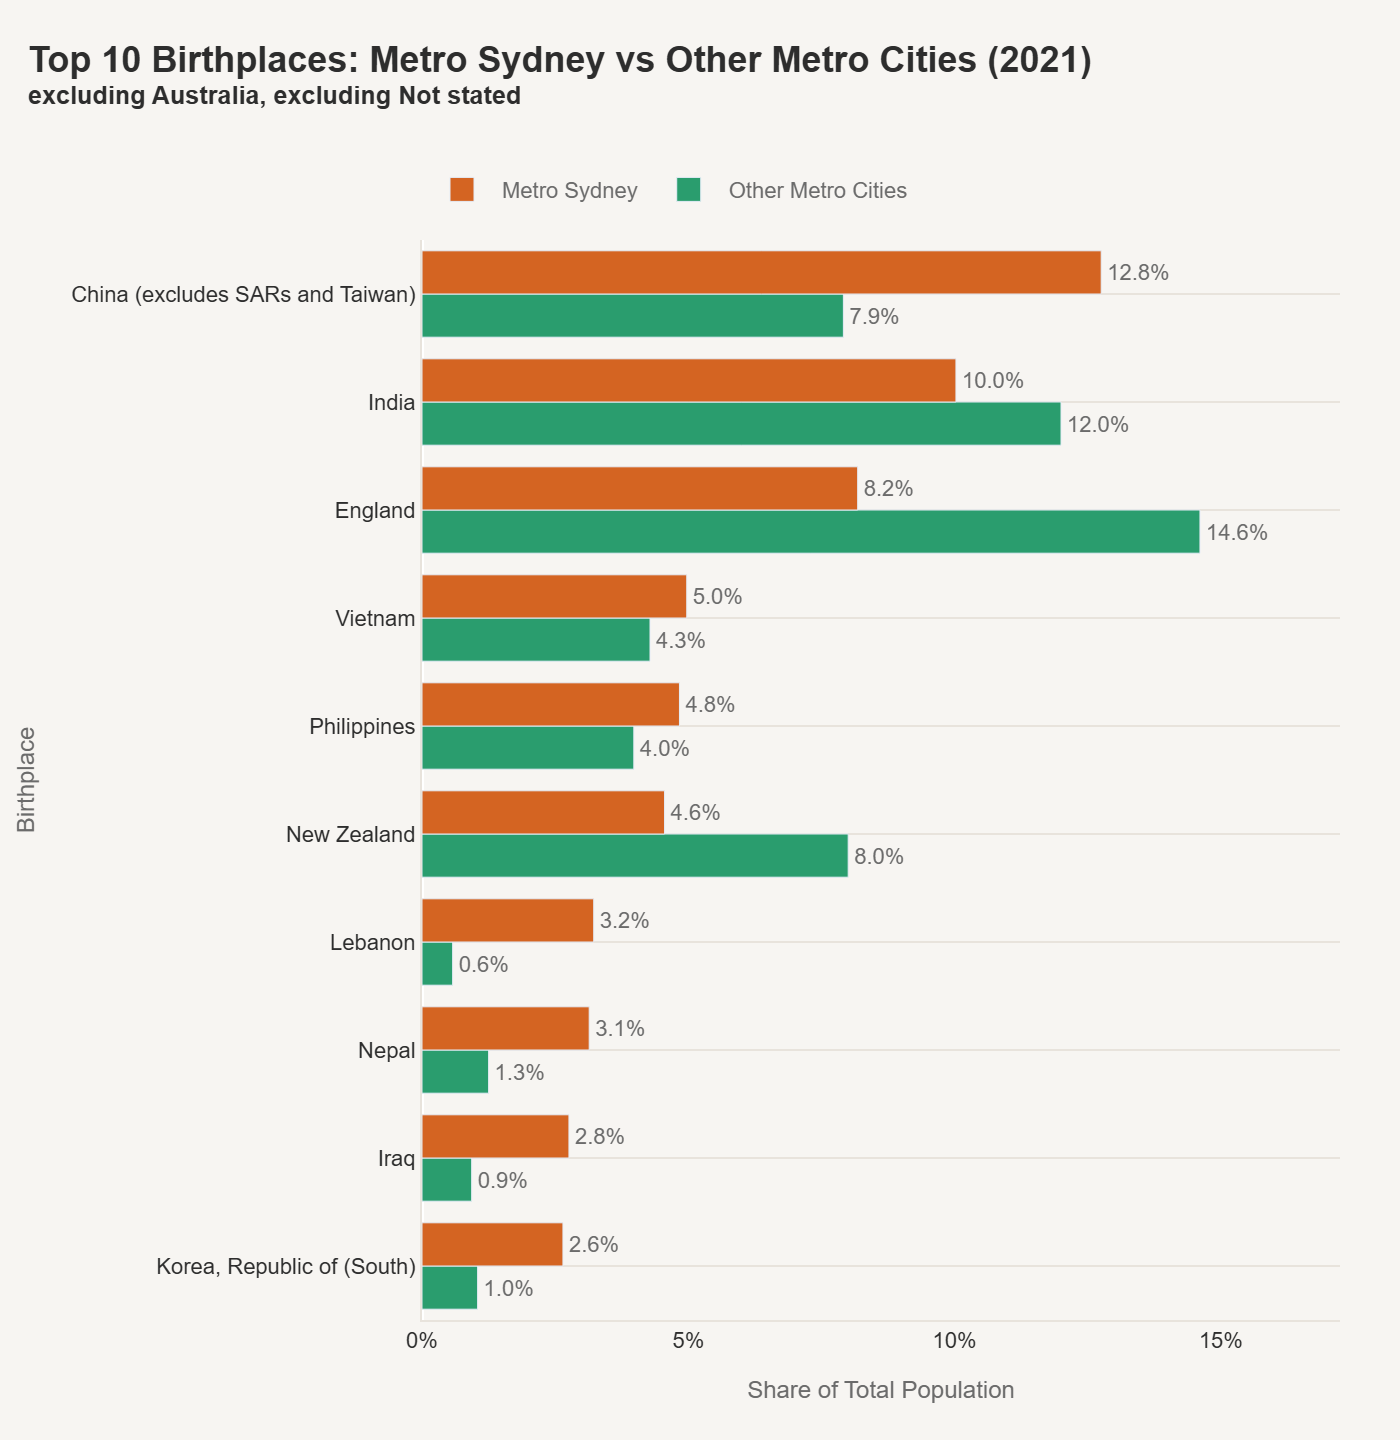
Sydney's China-born share (12.8%) is well above other metro cities (7.9%). But the most distinctive Sydney signatures are further down the list: Lebanon (3.2% vs 0.6%), Iraq (2.8% vs 0.9%), Nepal (3.1% vs 1.3%), and South Korea (2.6% vs 1.0%). These aren't the largest communities in absolute terms, but they're the ones that most clearly define Sydney's demographic identity relative to the rest of the country.
The Lebanon and Iraq numbers reflect communities with deep roots in western Sydney - established over decades through both skilled and humanitarian migration pathways. They give Sydney a Middle Eastern and North African demographic layer that no other Australian metro comes close to matching.
England tells the inverse story - other metro cities have a much higher England-born share (14.6%) compared to Sydney (8.2%). This reflects Perth, Adelaide, and Brisbane's stronger English-speaking migration pipelines. New Zealand is similarly skewed away from Sydney (8.0% vs 4.6%).
Sydney vs Regional NSW
The metro-to-regional contrast in NSW is stark.
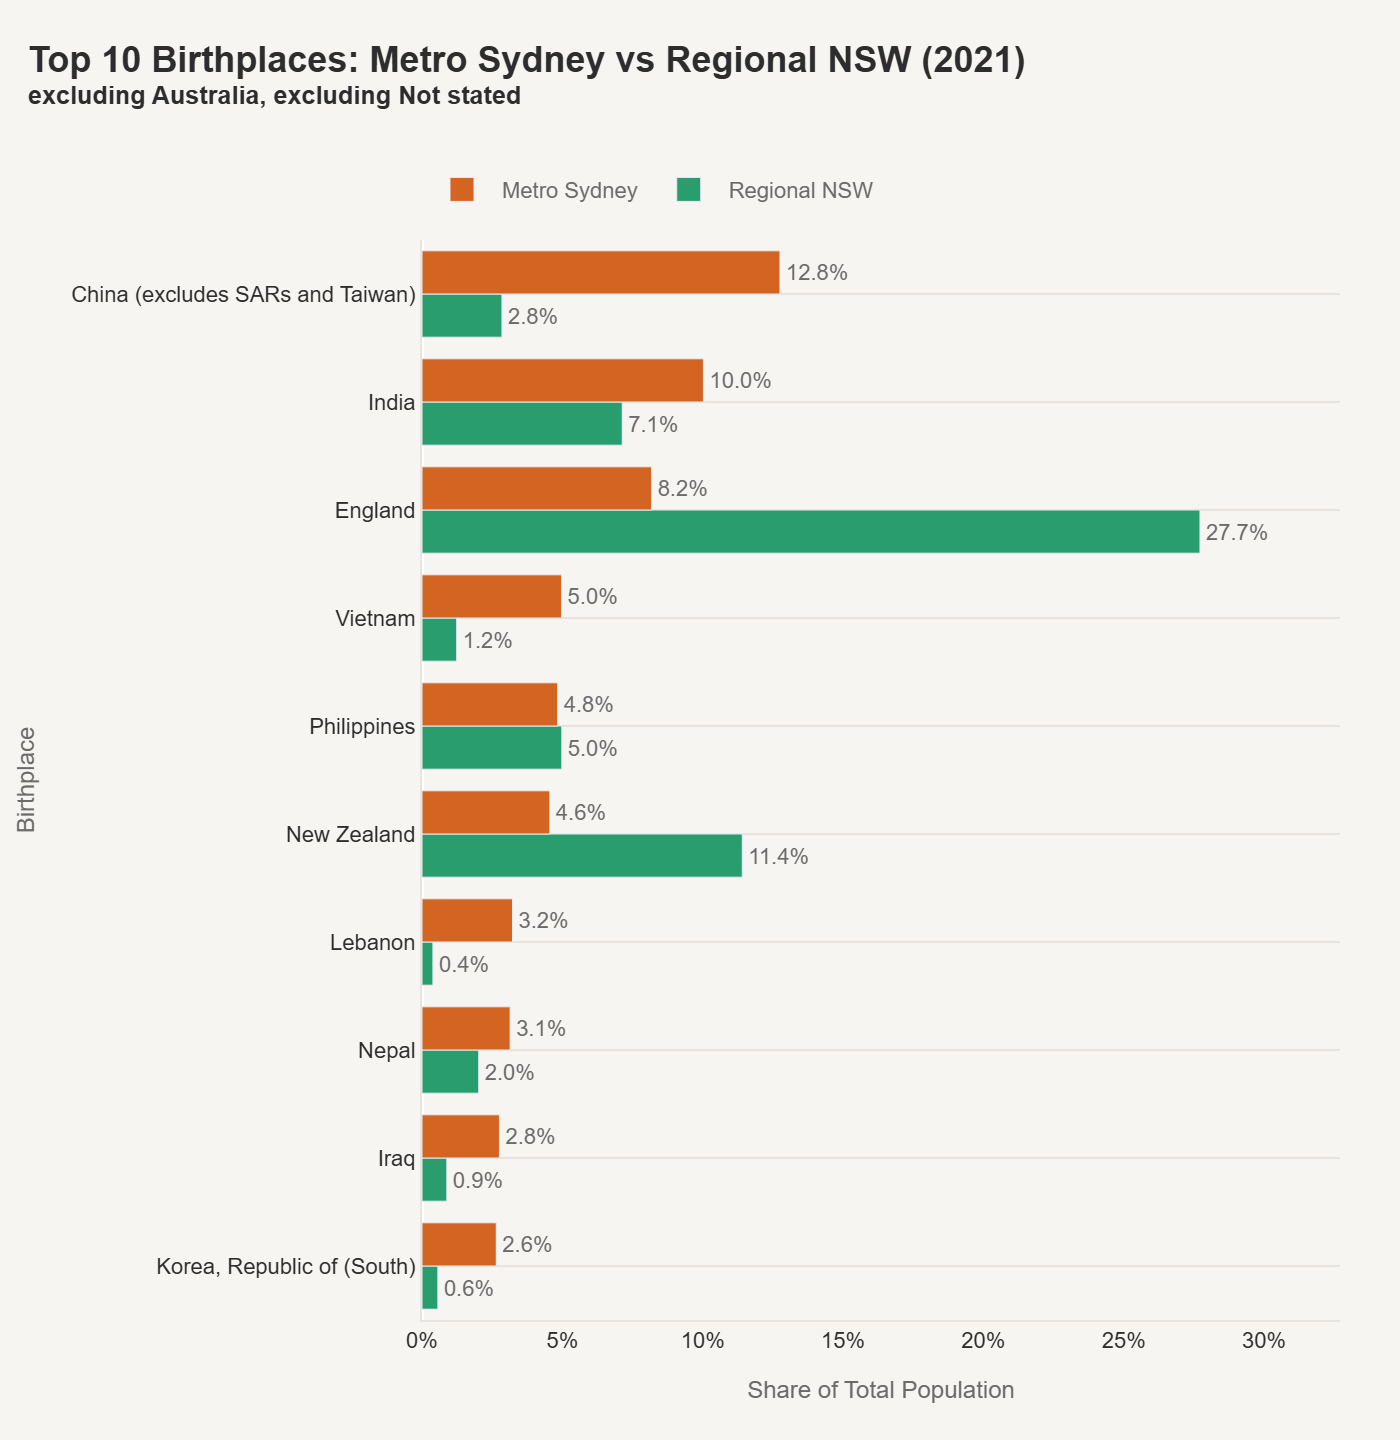
Regional NSW is dominated by England at 27.7% of the overseas-born population. New Zealand is the second largest at 11.4%. Meanwhile, China drops from 12.8% in the metro area to just 2.8% regionally, and India from 10.0% to 7.1%.
The Philippines is one of the few countries that holds its share between metro and regional (4.8% vs 5.0%), likely reflecting healthcare and agricultural worker settlement in regional centres. Nepal also has a surprisingly strong regional presence at 2.0%, potentially linked to regional university and aged care pathways.
The practical implication: the services, infrastructure, and cultural networks that support Sydney's diverse migrant communities are overwhelmingly concentrated in the metro area. Regional NSW's overseas-born population is structurally different - older, more English-speaking, and less linguistically diverse.
Language: Arabic is Sydney's signature
Sydney's language profile is where the city most clearly distinguishes itself from every other Australian metro.
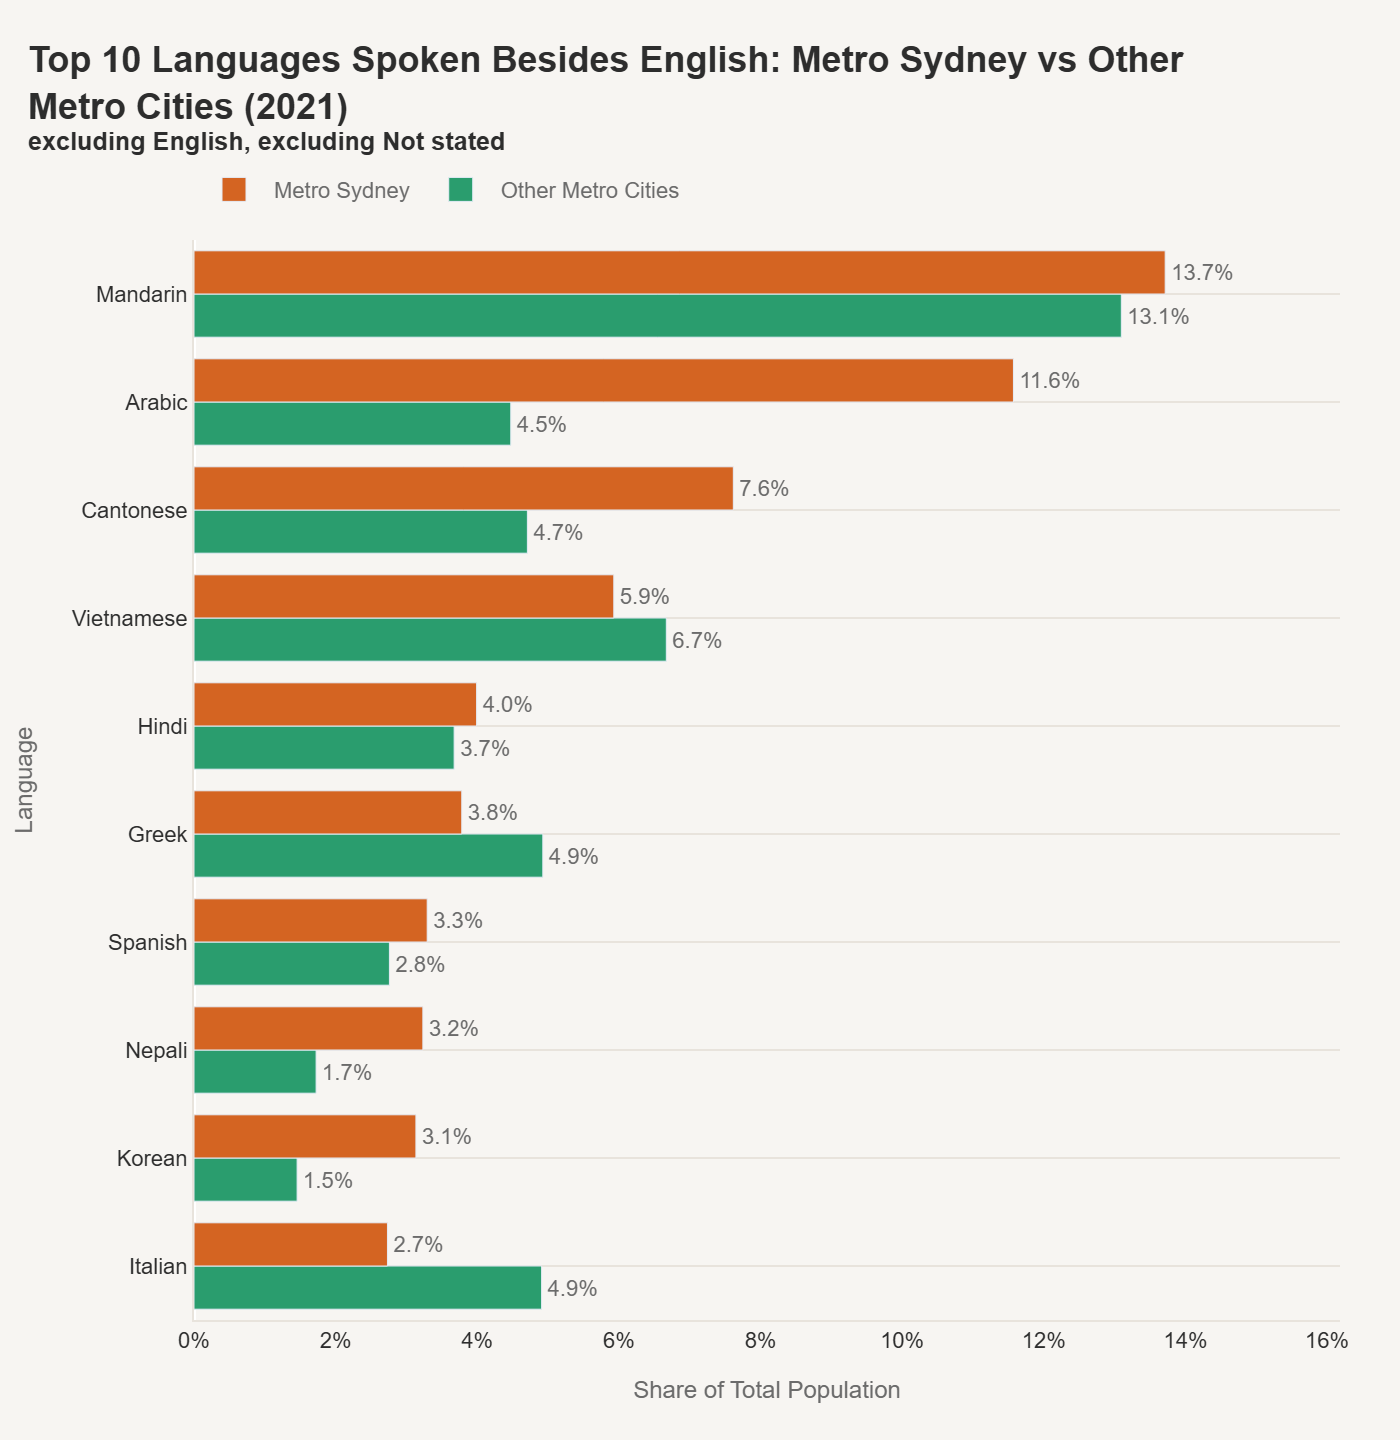
Mandarin leads at 13.7%, close to other metro cities at 13.1%. But Arabic is where Sydney stands alone: 11.6% of non-English language speakers compared to just 4.5% in other metros. That's a 2.5x over-representation and it makes Arabic the defining linguistic feature of Sydney's demographic profile.
Cantonese is also notably higher (7.6% vs 4.7%), reflecting Sydney's longer history as a destination for Hong Kong and Guangdong migration. Korean (3.1% vs 1.5%) and Nepali (3.2% vs 1.7%) are also distinctively elevated. Greek and Italian, which feature prominently in other capitals, sit lower in Sydney's ranking.
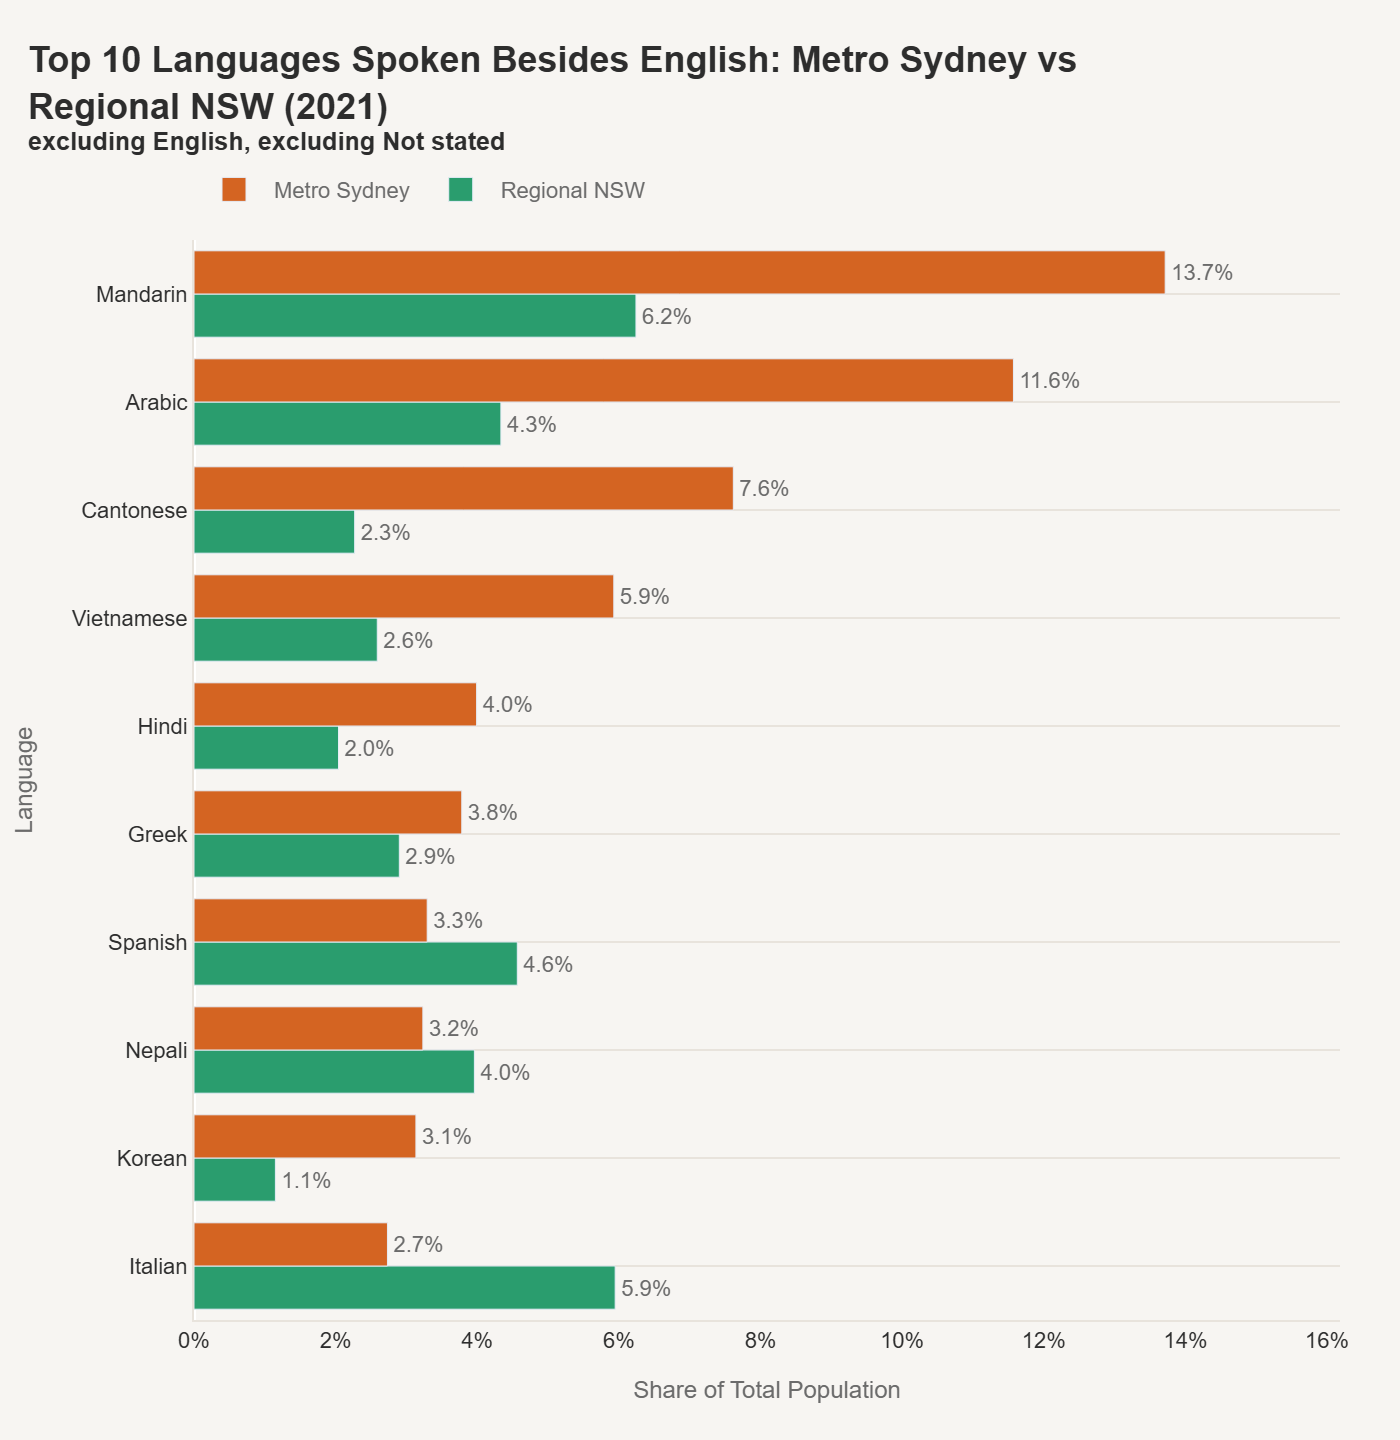
The regional language picture has some interesting wrinkles. Mandarin drops from 13.7% to 6.2% - a steep fall but still the largest non-English language regionally. Arabic drops from 11.6% to 4.3%, which is still substantial and likely concentrated in specific regional centres.
The surprises are the languages that punch above their metro weight regionally: Italian (5.9% vs 2.7%), Spanish (4.6% vs 3.3%), and Nepali (4.0% vs 3.2%). The Italian numbers likely reflect agricultural and regional industry settlement patterns built up over decades, while Nepali's regional strength maps to university and care sector pathways outside Sydney.
Religion: Sydney holds onto faith longer
The religion data captures something structurally important about Sydney - it remains notably more religious than the Australian metro average.
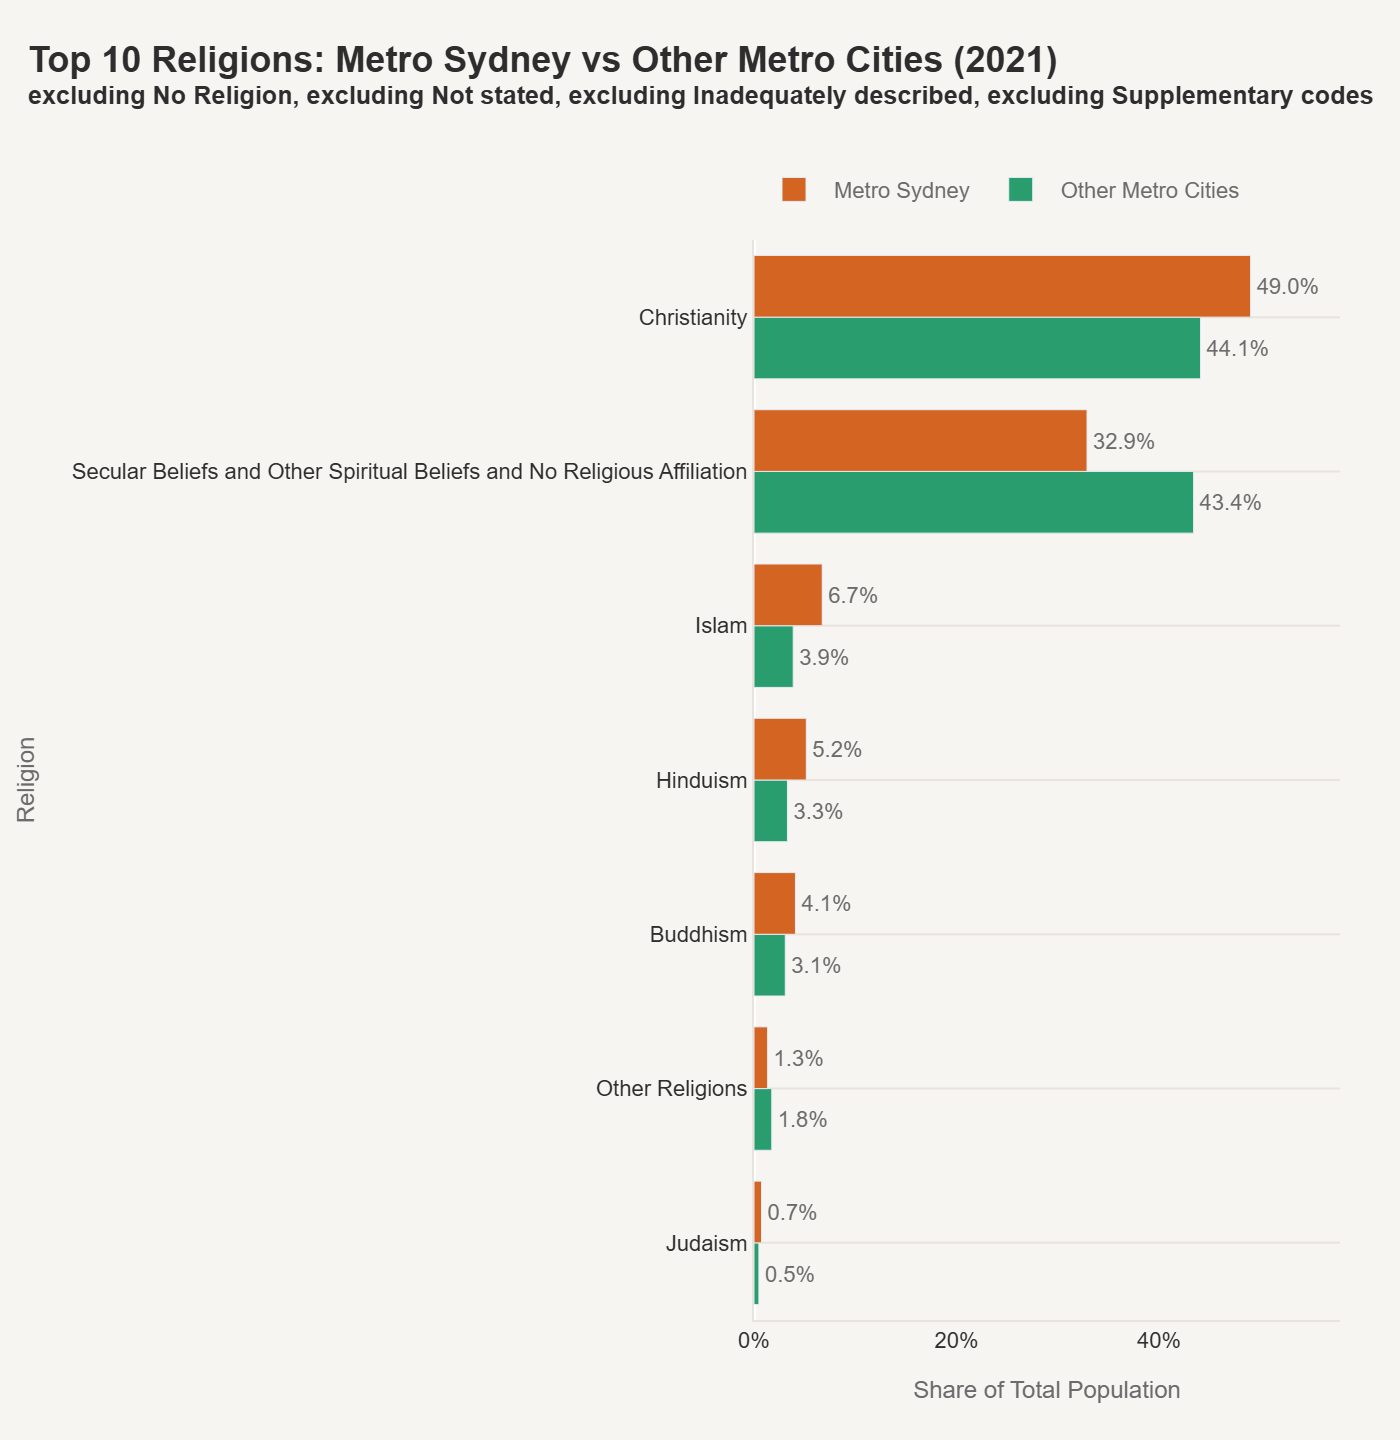
Metro Sydney's Christian population sits at 49.0%, compared to 44.1% across other metro cities. Secular beliefs are at 32.9%, well below the 43.4% in other metros. Sydney is one of the few major Australian cities where Christianity still holds a clear plurality over secular identification.
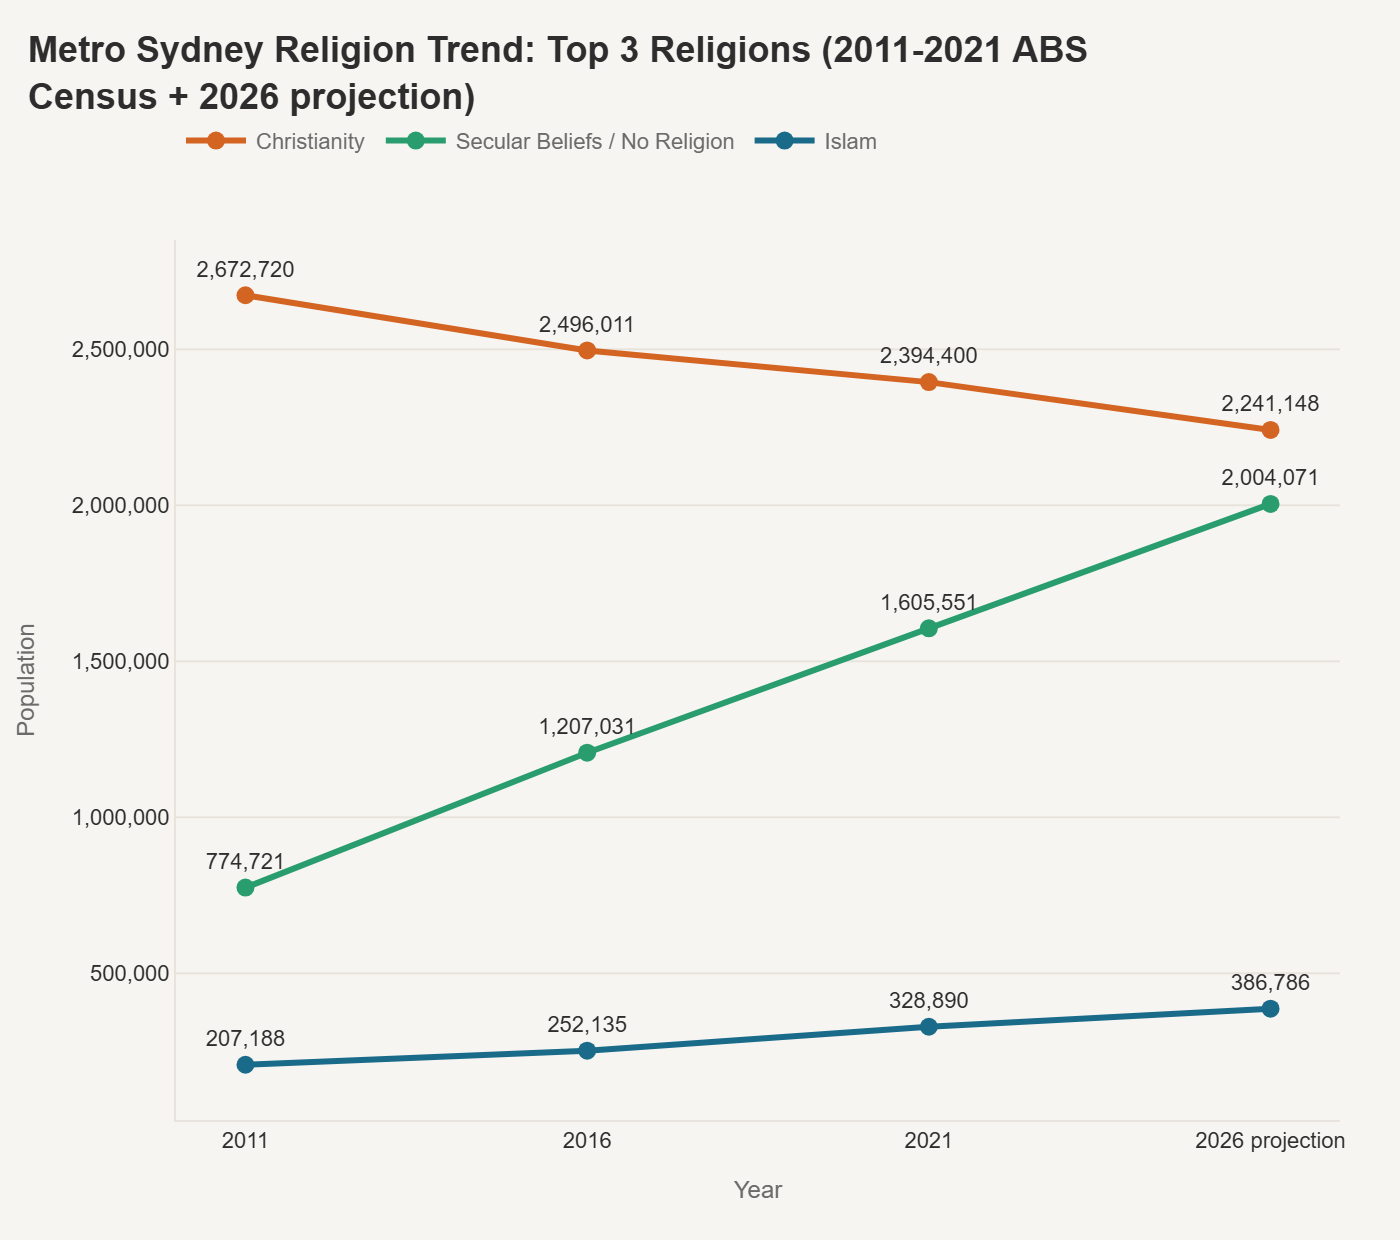
The trend lines tell the story. Christianity has declined from 2.67 million in 2011 to 2.39 million in 2021, with the projection putting it at 2.24 million by 2026. Secular beliefs have risen sharply from 775,000 to 1.61 million over the same period, projected to reach 2.0 million by 2026. The lines are converging but haven't crossed yet - the crossover is likely coming in the next census cycle.
Part of the reason Sydney trails the national secular trend is migration composition. Sydney's large communities from the Middle East, South Asia, and Southeast Asia tend to be more religiously observant. Islam at 6.7% is nearly double the other-metro average of 3.9%, and has grown steadily from 207,000 in 2011 to 329,000 in 2021, projected at 387,000 by 2026. Hinduism (5.2% vs 3.3%) and Buddhism (4.1% vs 3.1%) are also elevated.
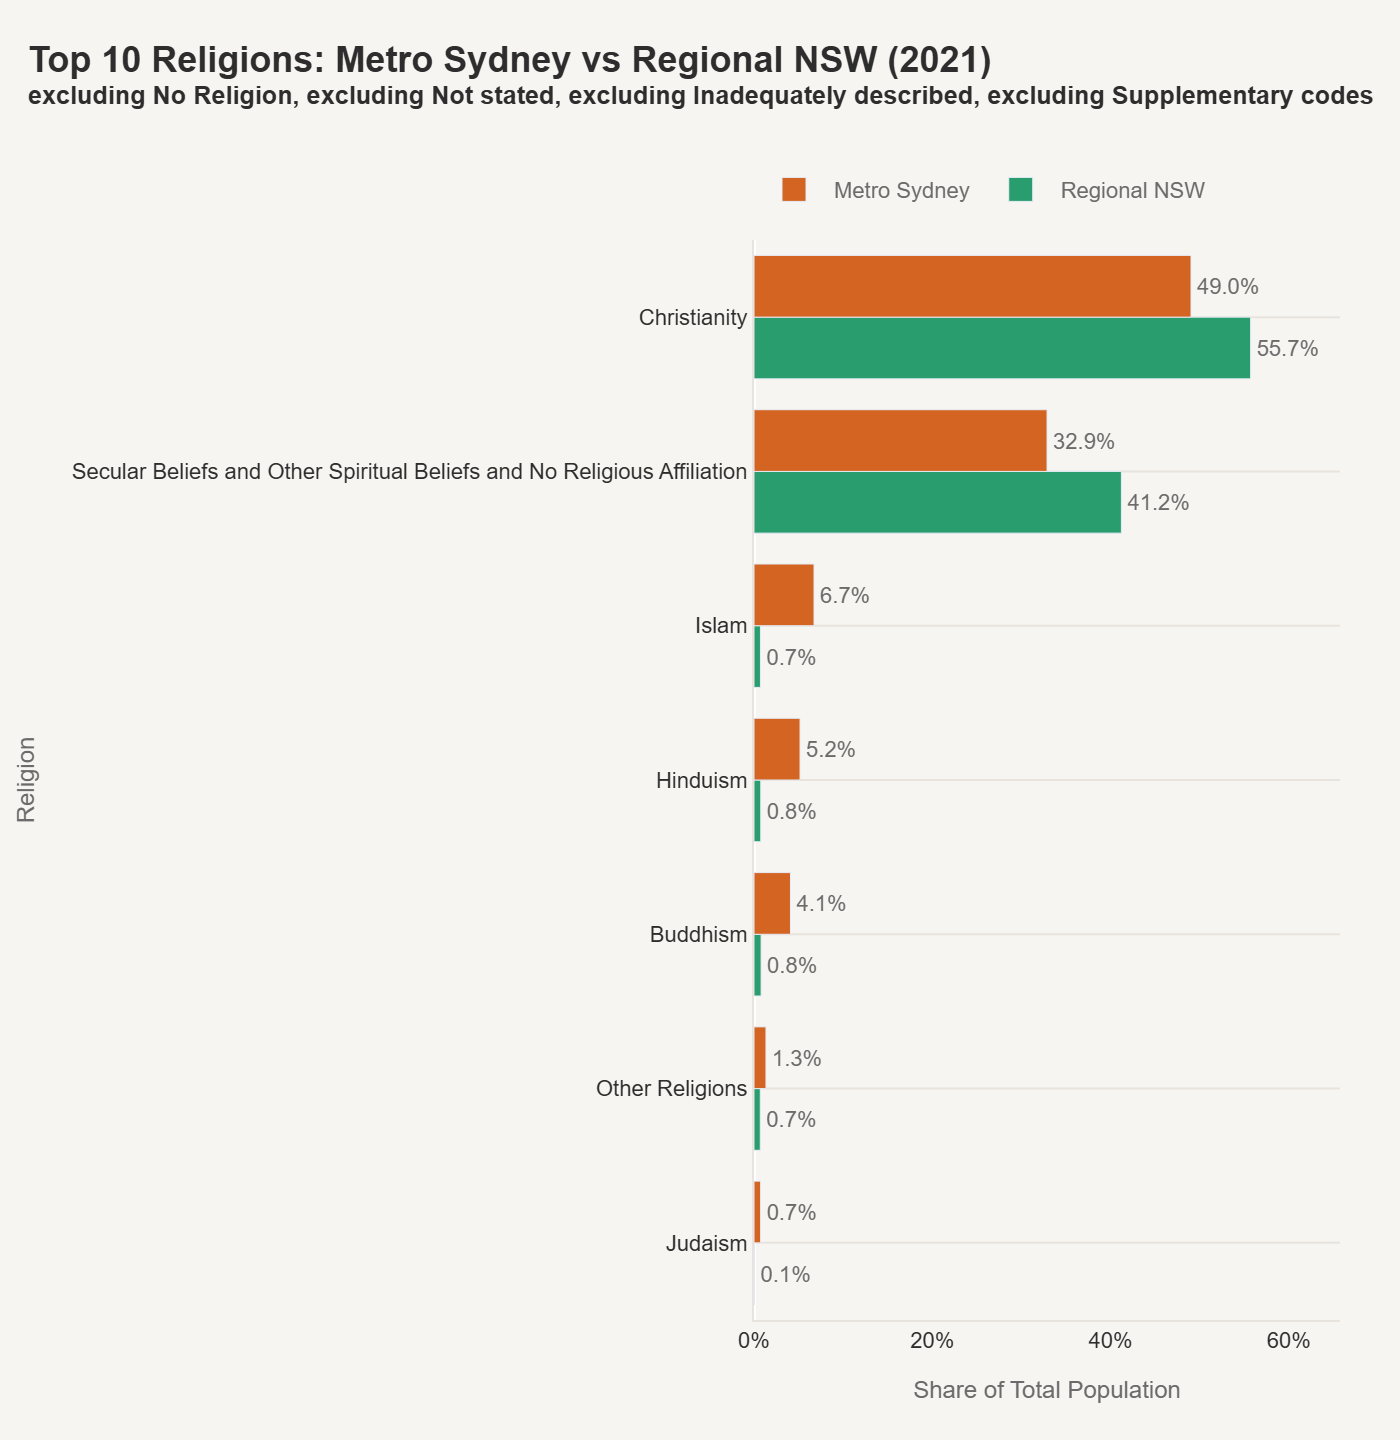
Regional NSW follows a familiar pattern: more Christian (55.7%), more secular (41.2%), and with Islam (0.7%), Hinduism (0.8%), and Buddhism (0.8%) essentially absent. The religious diversity that characterises Metro Sydney - its substantial Muslim, Hindu, and Buddhist communities - is almost entirely a metro phenomenon.
Where is the diversity?
Using the same normalised Shannon diversity index, I looked at which NSW suburbs have the most evenly distributed mix of overseas birthplaces.
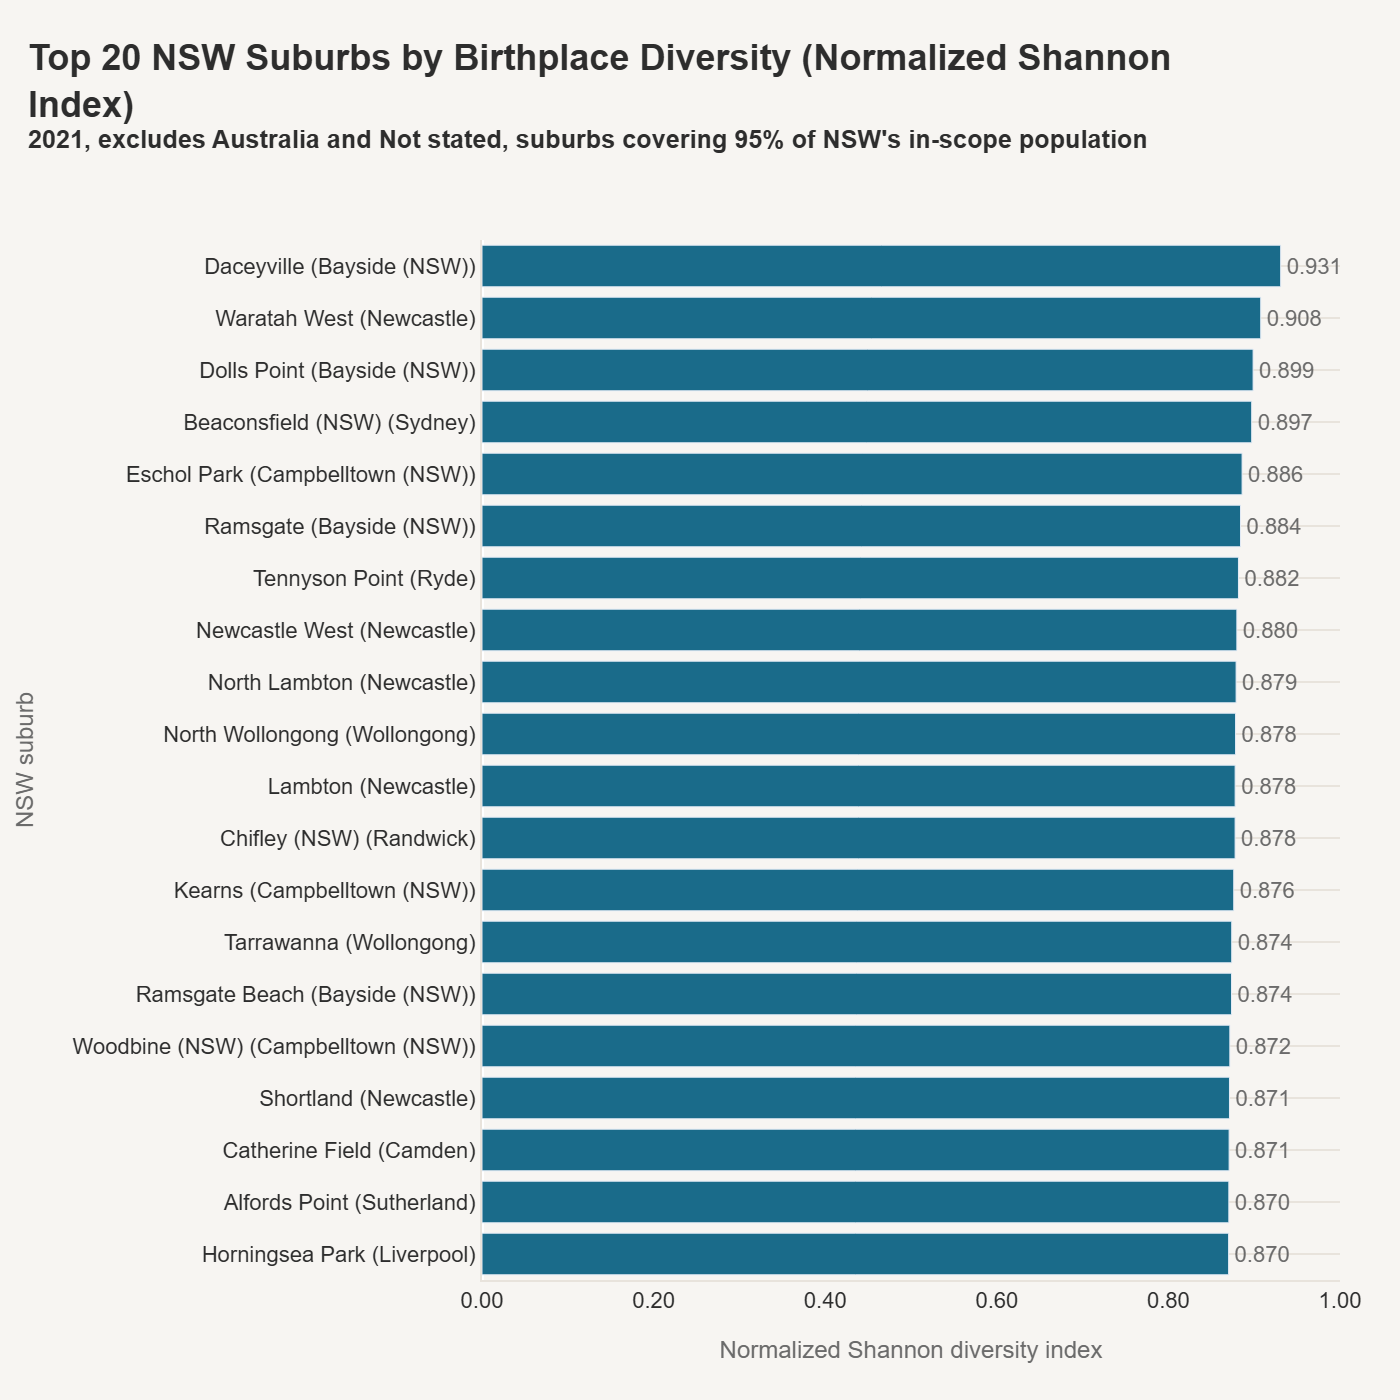
Daceyville in Sydney's Bayside area leads the state with a Shannon index of 0.931. The Bayside LGA features prominently with Dolls Point (0.899), Ramsgate (0.884), and Ramsgate Beach (0.874) all making the top 20. Campbelltown also clusters strongly - Eschol Park (0.886), Kearns (0.876), and Woodbine (0.872) all appear.
One of the more interesting patterns is how strongly Newcastle features. Waratah West (0.908), Newcastle West (0.880), North Lambton (0.879), Lambton (0.878), and Shortland (0.871) all make the list. Wollongong also appears with North Wollongong (0.878) and Tarrawanna (0.874). This suggests that NSW's major satellite cities have genuinely mixed populations - these aren't just overflow suburbs, they have established birthplace diversity in their own right.
The Shannon index was filtered for suburbs covering 95% of NSW's in-scope population, which removes very small suburbs where a handful of residents could distort the score.
What this doesn't tell you
Census data captures who lives where and what they report on the form. It doesn't capture the lived experience of those communities - how connected or isolated people feel, whether services are adequate, or how identity evolves between generations.
The 2026 projections are linear extensions of 2011–2021 trends. They're useful as a direction indicator but shouldn't be treated as forecasts. Migration policy changes, economic shocks, and global events can all bend these curves. China's slowing growth between 2016 and 2021 is a concrete example of how external factors can redirect what looked like a stable trajectory.
The real value of this dataset is that it provides a consistent, comparable base. When the actual 2026 census data drops, I'll be able to slot it in and see how well the projections held - and where the surprises are.
The methodology piece explains the harmonisation approach. The Melbourne edition covers that city using the same framework.
If you'd like to explore suburb-level or LGA data, I've created a dashboard here.