01 - The problem
Census geography changes make local trends hard to trust
Comparing a suburb across three Census editions sounds like a lookup job: pull 2011, 2016 and 2021, line them up and read the trend. In practice the boundaries underneath don't sit still. Suburbs split, LGAs merge, codes change, and even the small statistical areas the ABS builds everything from are redrawn each edition. A straight comparison can't tell the difference between a community changing and a line on a map moving.
The cost of getting it wrong showed up immediately. My first attempt matched 2011 suburbs to 2021 suburbs by name, and roughly half of Australia's population fell out of the join. Anyone using that output to plan or pitch would have been reading boundary changes as demographic change, with no way of knowing.
02 - What I built
A field report for any suburb or LGA
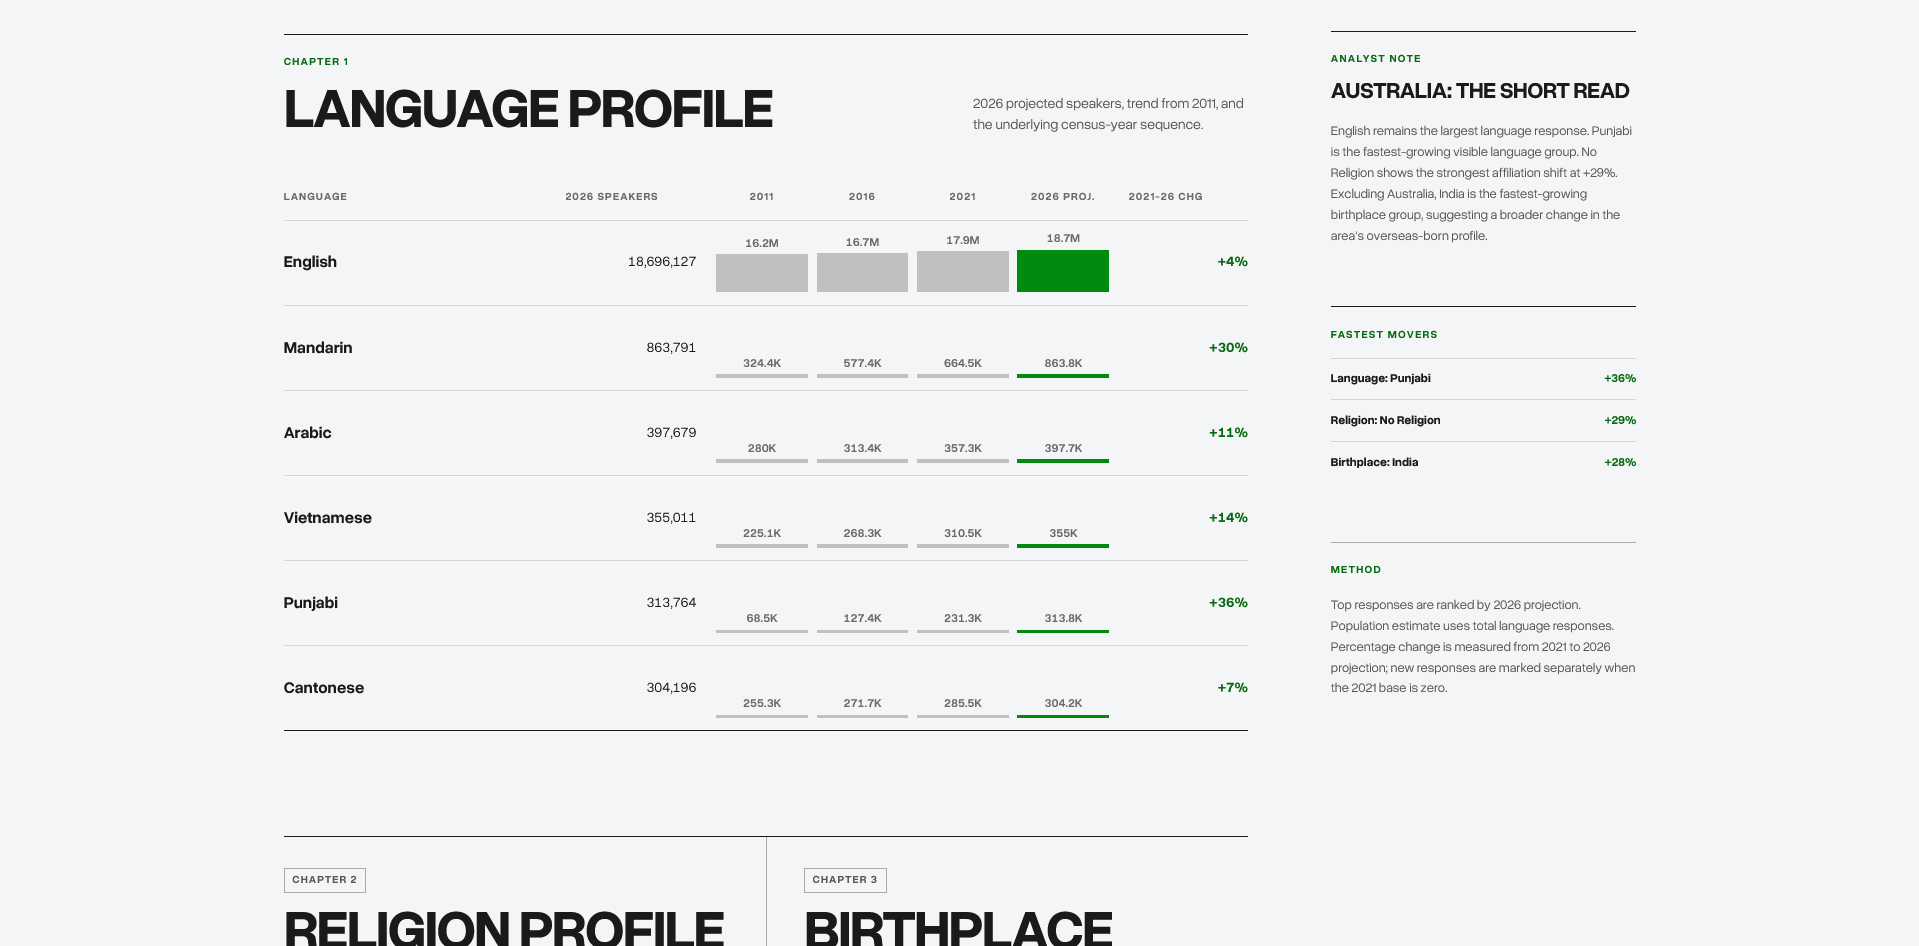
The tool lets someone search any Australian suburb, locality or LGA and get a local profile across language, religion and birthplace. Each chapter shows the 2011, 2016 and 2021 counts, a 2026 projection and the change since 2021, with a plain-English summary at the top and the full source table underneath. Toggles for English and “Not stated” responses let the reader choose between the whole picture and the movement within other groups, and each report can be downloaded as a CSV.
I built it for a client who needed to answer local demographic questions without sending each one back to an analyst, and they now use it for planning and pitches. The interface is deliberately simple, a search box and a report, because the hard part lives in the data underneath it.
03 - How it works
Rebuild from the smallest unit, then roll forward
The fix was to stop comparing named places and work from SA1s, the small statistical areas the ABS publishes data for. For each Census year I pulled the variables from TableBuilder at SA1 level, used the ABS allocation files to map that year's SA1s to that year's suburbs and LGAs, and aggregated each year on its own boundaries. At that point each year was internally correct but still not comparable.
The comparable series came from the ABS correspondence files, which map 2011 SA1s to 2016 and 2016 SA1s to 2021 using population weights. I chained those forward so older counts were redistributed onto 2021 SA1s before being rolled back up to 2021 suburbs and LGAs, and coverage went from roughly half to near-complete. Buckets like “No usual address” were excluded, and the handful of SA1s straddling two areas were allocated by majority rule rather than over-engineering a fix for a tiny share of records.
For 2026 I tested compound and log-style growth before settling on a straight linear projection. With three data points per area, anything fancier produced runaway trends for small, fast-growing groups, and an early version added up to 52 million Australians until I reconciled it back to the national total. Linear was easier to explain, easier to audit and kept the totals in line with ABS expectations.
04 - Walkthrough
From place search to local context
05 - Outcomes
What it covers
suburbs, localities and LGAs you can search
Census topics: language, religion and birthplace
of harmonised trend data, 2011 to 2026
of the 2011 population recovered after dropping name matching
06 - What I learned
What I'd carry forward
Check coverage before trends
The name-matching version produced charts that looked fine. Only checking how much of the population survived the join showed half of it was missing.
Work from the smallest stable unit
Comparing named places breaks as soon as boundaries move. Working from SA1s within each year, then rolling forward with correspondence files, kept every step checkable.
Pick the projection you can defend
A linear projection is less impressive than a growth model, but with three data points it's the one I can explain to a client and check against the national total.
Keep the complexity in the data layer
The client wanted to look up a suburb and get an answer, so the interface is a search box and a report, and the difficult decisions sit underneath.
Related analysis
How the data was built and analysed
Read the full Census harmonisation method, see the projection bug that made Australia double in size, or browse the rest of my public data and demographics writing.