01 - The problem
Performance data is useless if it cannot separate edge from behaviour
A P&L chart can show whether the account is up or down, but it cannot show whether the trader followed the plan, whether a setup still works, or whether a bad week is statistical noise.
02 - What I built
A dashboard that connects process to outcomes
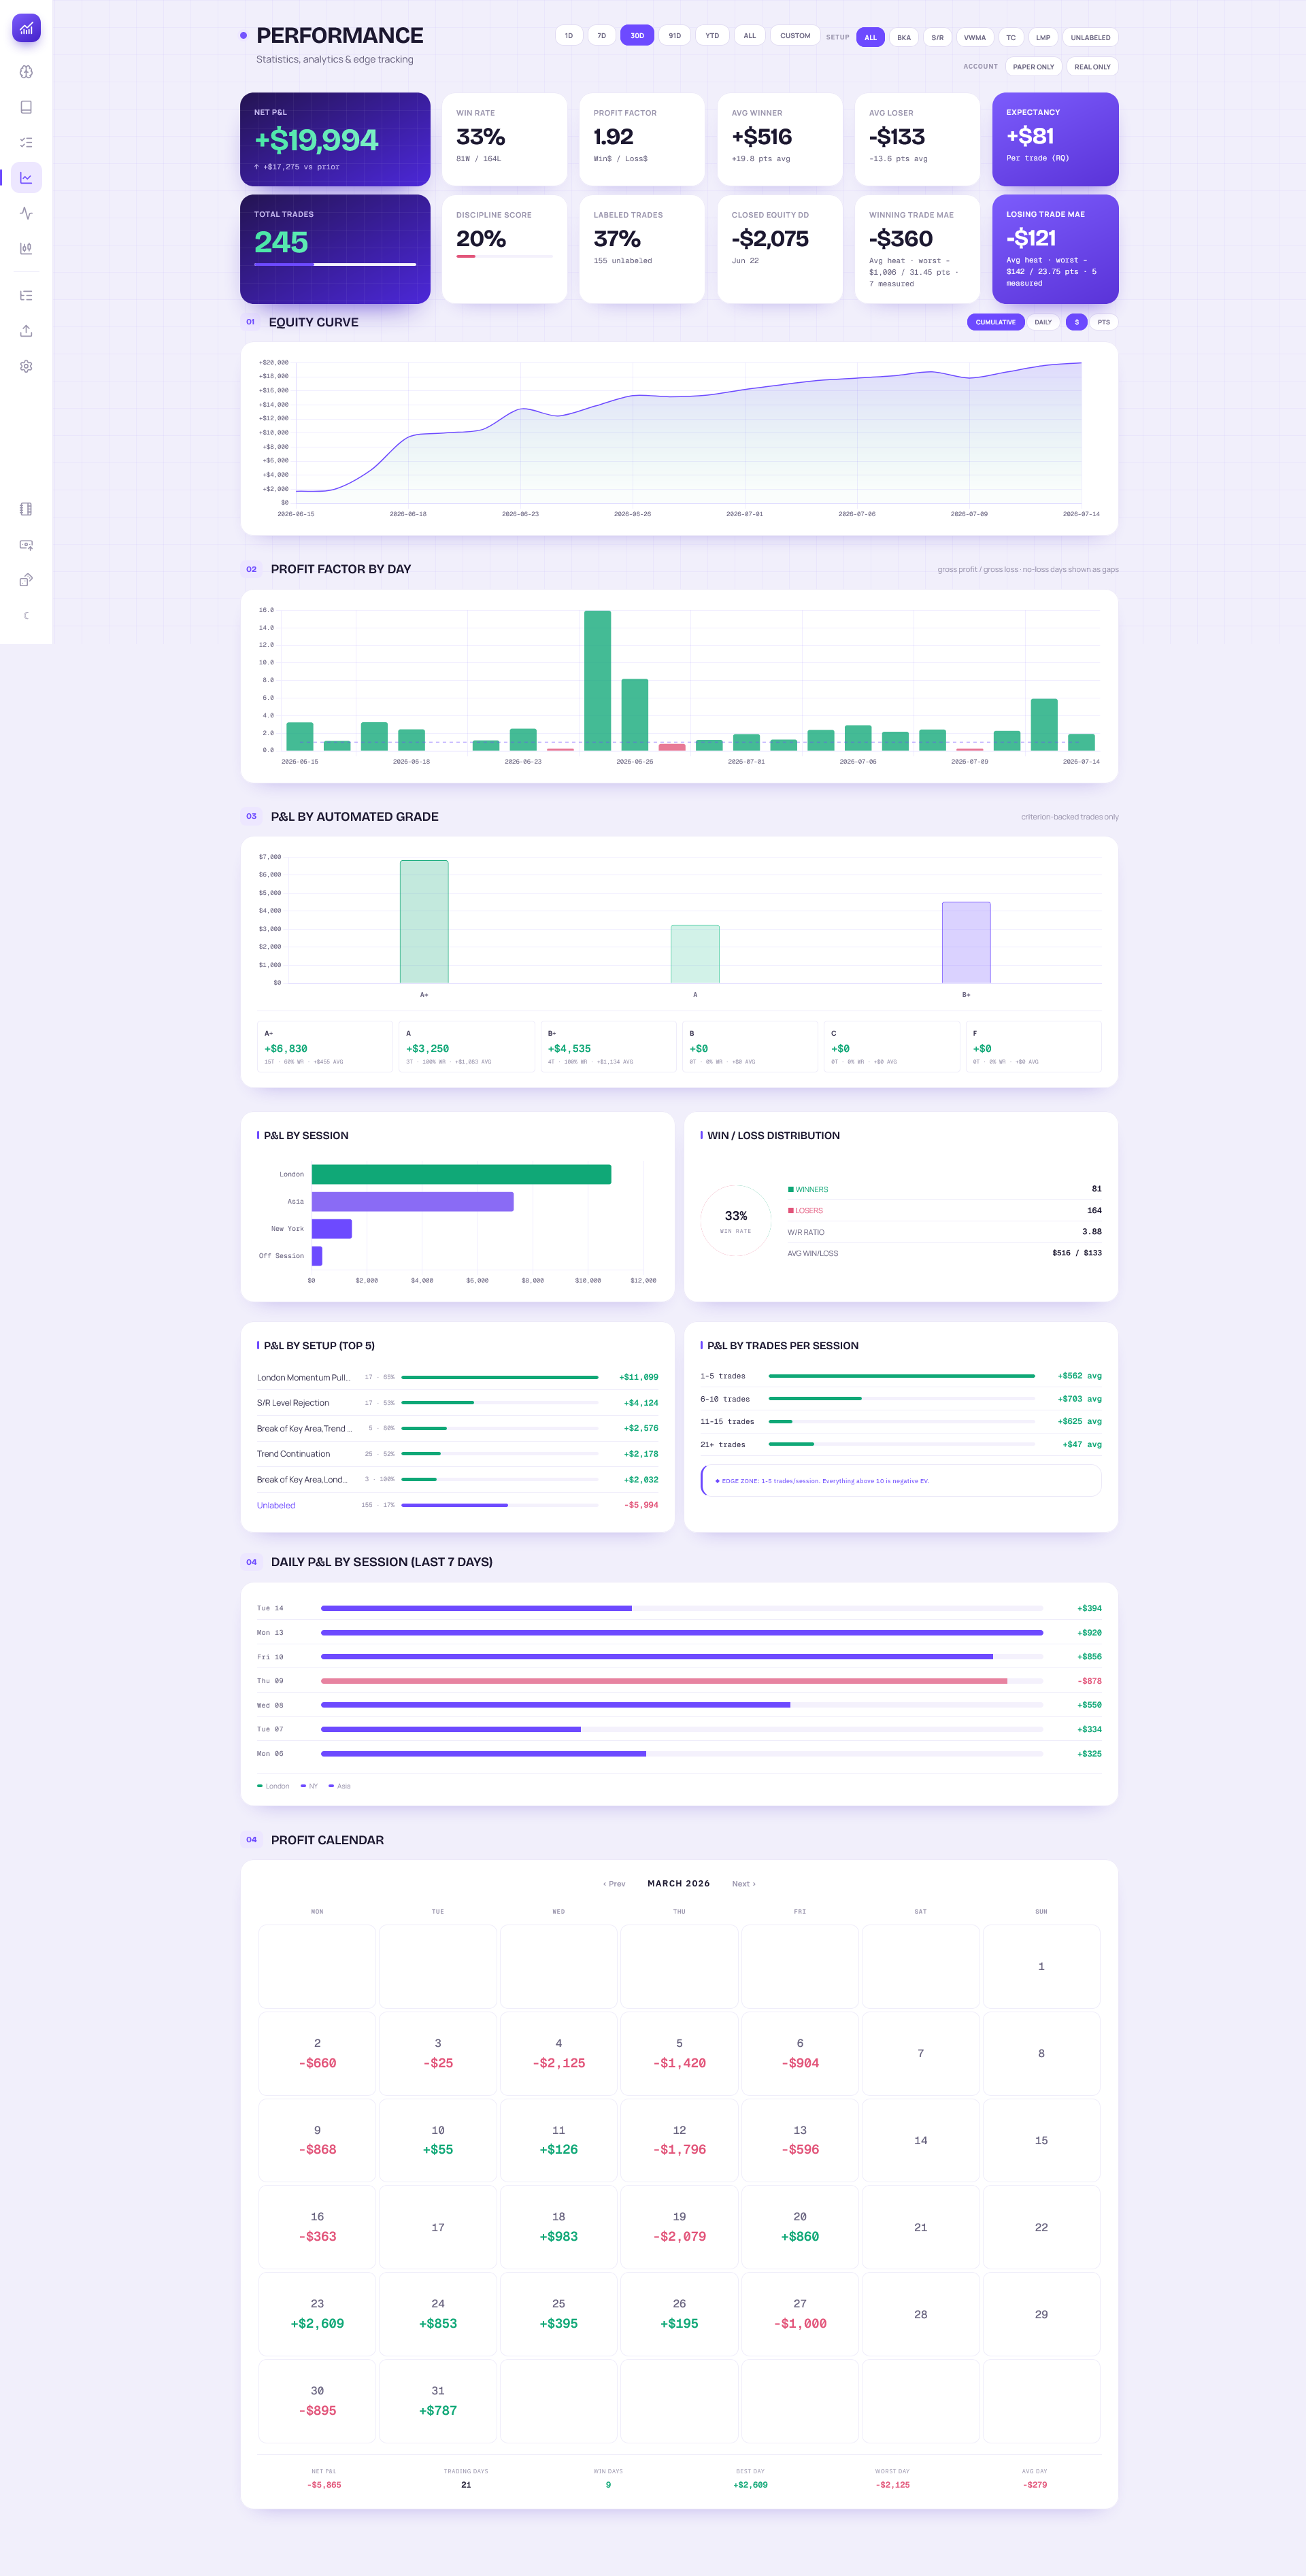
The app tracks P&L, win rates, setup effectiveness, mental state, rule adherence, and projection risk in one place. It is designed to answer the operational question after each session: was the edge real, and did I follow it?
03 - Walkthrough
From session records to edge quality
04 - Outcomes
What it clarifies
Weekly
scorecards for process review
Setup
edge quality tracked by strategy type
Risk
projection tooling grounded in real outcomes
Live
private production system